Exciting things are happening at Sync as we move further into the new year!
Ensuring that our users are equipped with the tools to fully manage the automation of their infrastructure is always top of mind. With the most recent iteration of Gradient, Sync users are able to take advantage of a toolkit that makes optimizing Databricks clusters even better.
Here’s what’s new in the latest version of Gradient:
Org Settings
Org Settings is now available in the main navigation bar in the Sync Dashboard. Users are able to navigate to the Org Settings tab to find personal user information, a comprehensive list of API keys, and a list of organization users with their user details.
With Org Settings, users will see a consolidated list of personal information, API keys, and account users directly in the Sync UI.
Stay up to date with the latest feature releases and updates at Sync by visiting our Product Updates documentation. Ready to start getting the most out of your Databricks job clusters? Reach out to us at info@synccomputing.com.
The Databricks Jobs API allows users to programmatically create, run, and delete Databricks Jobs via their REST API solution. This is an alternative to running Databricks jobs through their console UI system. For access to other Databricks platforms such as SQL warehouses, delta live tables, unity catalog, or others, users will have to implement other API solutions provided by Databricks.
However, for newcomers to the Jobs API, I recommend starting with the Databricks Jobs documentation which has great examples and more detailed explanations.
Why should I use the Jobs API?
Users may want to use an API, vs. the UI, when they need to dynamically create jobs due to other events, or to integrate with other non-Databricks workflows, for example Airflow or Dagster. Users can implement job tasks using notebooks, Delta Live Tables pipelines, JARS, or Python, Scala, Spark submit, and Java applications.
Another reason to use the Jobs API is to retrieve and aggregate metrics about your jobs to monitor usage, performance, and costs. The information in the Jobs API is far more granular than those present in the currently available System Tables.
So if your organization is looking to monitor thousands of jobs at scale and build dashboards, you will have to use the Jobs API to collect all of the information.
What can I do with the Jobs API?
A full list of the Jobs API PUT and GET requests can be found in the table below, based on the official API documentation.
Action
Request
Description
Get job permissions
/api/2.0/permissions/jobs/{job_id}
Gets the permissions of a job such as ‘user name’, ‘group name’, ‘service principal’, ‘permission level’
Gets the permission levels that a user can have on an object
Create a new job
/api/2.1/jobs/create
Create a new Databricks Job
List jobs
/api/2.1/jobs/list
Retrieves a list of jobs and their parameters such as ‘job id’, ‘creater’, ‘settings’, ‘tasks’
Get a single job
/api/2.1/jobs/get
Gets job details for a single job
Update all job settings (reset)
/api/2.1/jobs/reset
Overwrite all settings for the given job.
Update job settings partially
/api/2.1/jobs/update
Add, update, or remove specific settings of an existing job
Delete a job
/api/2.1/jobs/delete
Deletes a job
Trigger a new job run
/api/2.1/jobs/run-now
Runs a job with an existing job-id
Create and trigger a one-time run
/api/2.1/jobs/runs/submit
Submit a one-time run. This endpoint allows you to submit a workload directly without creating a job. Runs submitted using this endpoint don’t display in the UI.
List job runs
/api/2.1/jobs/runs/list
List runs in descending order by start time. A run is a job that has already historically been run.
Get a single job run
/api/2.1/jobs/runs/get
Retrieve the metadata of a single run.
Export and retrieve a job run
/api/2.1/jobs/runs/export
Export and retrieve the job run task.
Cancel a run
/api/2.1/jobs/runs/cancel
Cancels a job run
Cancel all runs of a job
/api/2.1/jobs/runs/cancel-all
Cancels all job runs
Get the output for a single run
/api/2.1/jobs/runs/get-output
Retrieve the output and metadata of a single task run.
Delete a job run
/api/2.1/jobs/runs/delete
Deletes a job run
Repair a job run
/api/2.1/jobs/runs/repair
Repairs a job run by re-running it
Can I get cost information through the Jobs API?
Unfortunately, users cannot obtain jobs cost directly through the Jobs API. You’ll need to use the accounts API to access billing information, or use System tables. One big note, is the billing information retrieved through either the accounts API or the system tables is only the Databricks DBU costs.
The majority of your Databricks costs could come from your actual cloud usage (e.g. on AWS it’s the EC2 costs). To obtain these costs you’ll need to separately retrieve cost information from your cloud provider.
If this sounds painful – you’re right, it’s crazy annoying. Fortunately, Gradient does all of this for you and can retrieve both the DBU and cloud costs for you in a simple diagram to monitor your costs.
How does someone intelligently control their Jobs clusters with the API?
The Jobs API is an input/output system only. What you do with the information and abilities to control and manage Jobs is entirely up to you and your needs.
For users running Databricks Jobs at scale, one dream ability is to optimize and intelligently control jobs clusters to minimize costs and hit SLA goals. Building such a system is not trivial and requires an entire team to develop a custom algorithm as well as infrastructure.
Here at Sync, we built Gradient to solve exactly this need. Gradient is an all-in-one Databricks Jobs intelligence system that works with the Jobs API to help automatically control your jobs clusters. Check out the documentation here to get started.
Updating From Jobs API 2.0 to 2.1
The largest update from API 2.0 to 2.1 is the inclusion of multiple tasks in a job, as described in the official documentation. To explain a bit more, Databricks jobs can contain multiple tasks in a single job, where each task can be a different notebook, for example. All API 2.1 requests must conform to the multi-task format and responses are structured in the multi-task format.
To create a job with the Databricks REST API, run the curl command below, which creates a cluster based on the parameters located in the create-job.json
The REST APIs are identical across all 3 cloud providers (AWS, GCP, Azure). Users can toggle between the different cloud versions in the reference page on the top left corner
Conclusion
The Databricks Jobs API is a powerful system which enables to programmatically control and monitor their jobs. Likely this is useful for “power users” who want to control many jobs or for users who need to use an external orchestrator, like Airflow, to orchestrate their jobs.
To add automatic intelligence to your Databricks Jobs API solutions to help lower costs and hit SLAs, check out Gradient as a potential fit.
Today we are excited to announce our next major product update for Gradient to help companies optimize their Databricks Jobs clusters. This update isn’t just a simple UI upgrade…
We upgraded everything from the inside out!
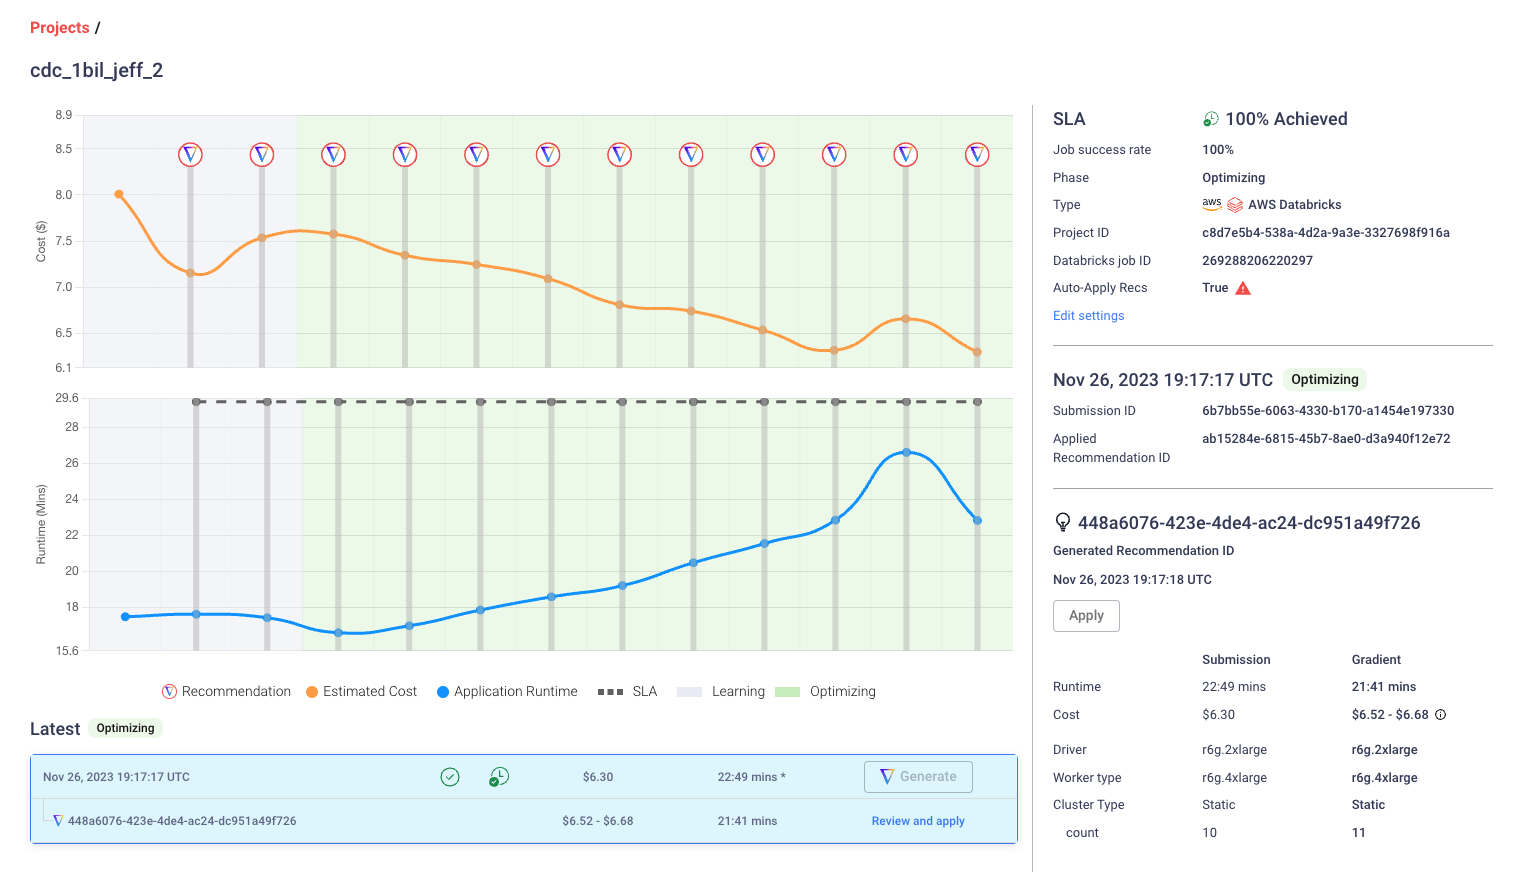
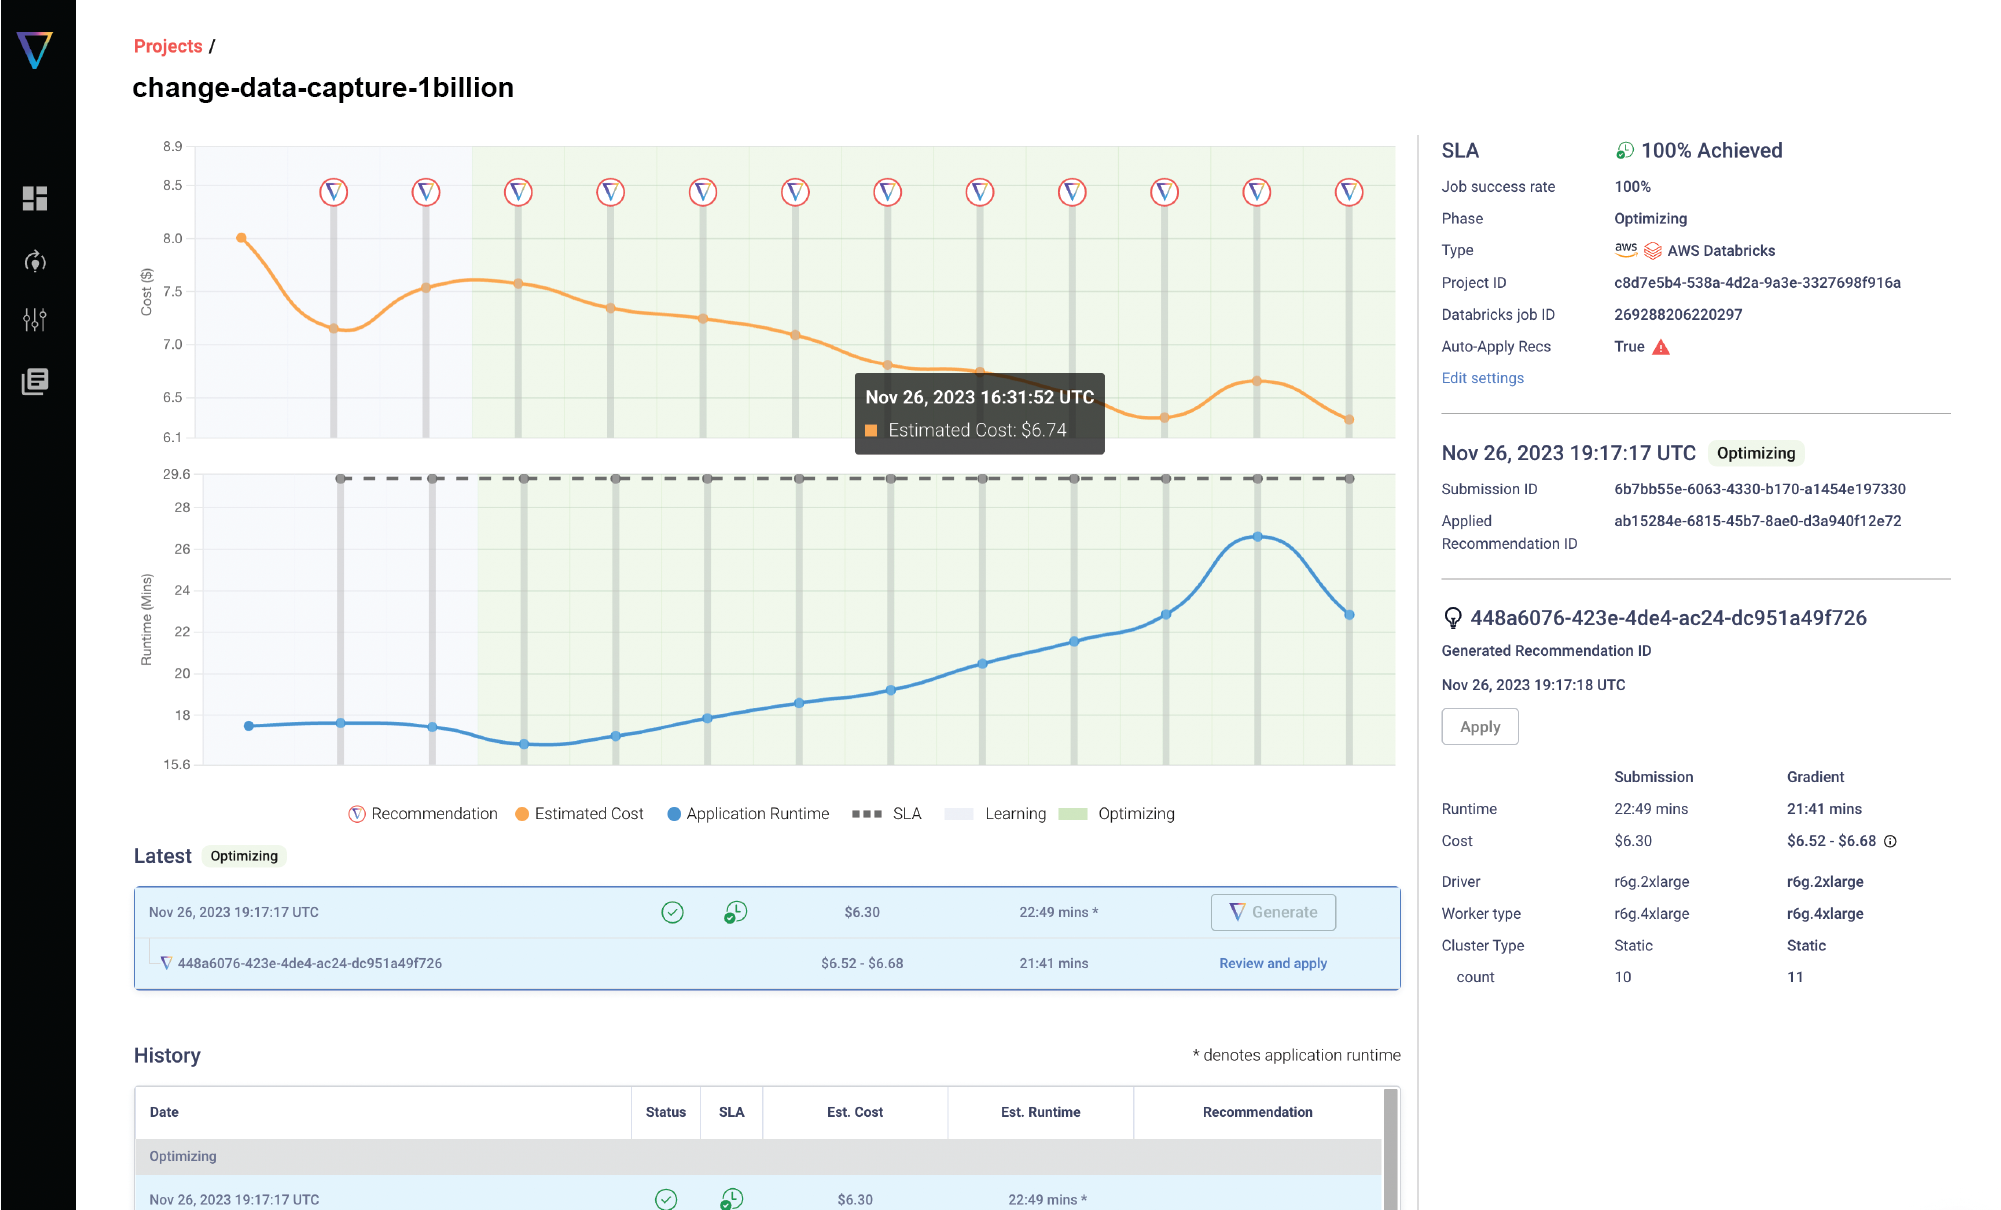
Without burying the lead, here’s a screenshot of the new project page for Gradient above.
Back in the last week of June of this year (2023), we debuted our first release of Gradient. In the past few months we gathered all of the user feedback on how we can make the experience even better.
So what were the high level major feature requests that we learned in the past few months?
Visualizations – Visual graphs which show the cost and runtime impact of our recommendations to see the impact and ROI of Gradient
Easier integration – Easier “one-click” installation and setup experience with Databricks
More gains – Larger cost savings gains custom tailored to the unique nature of each job
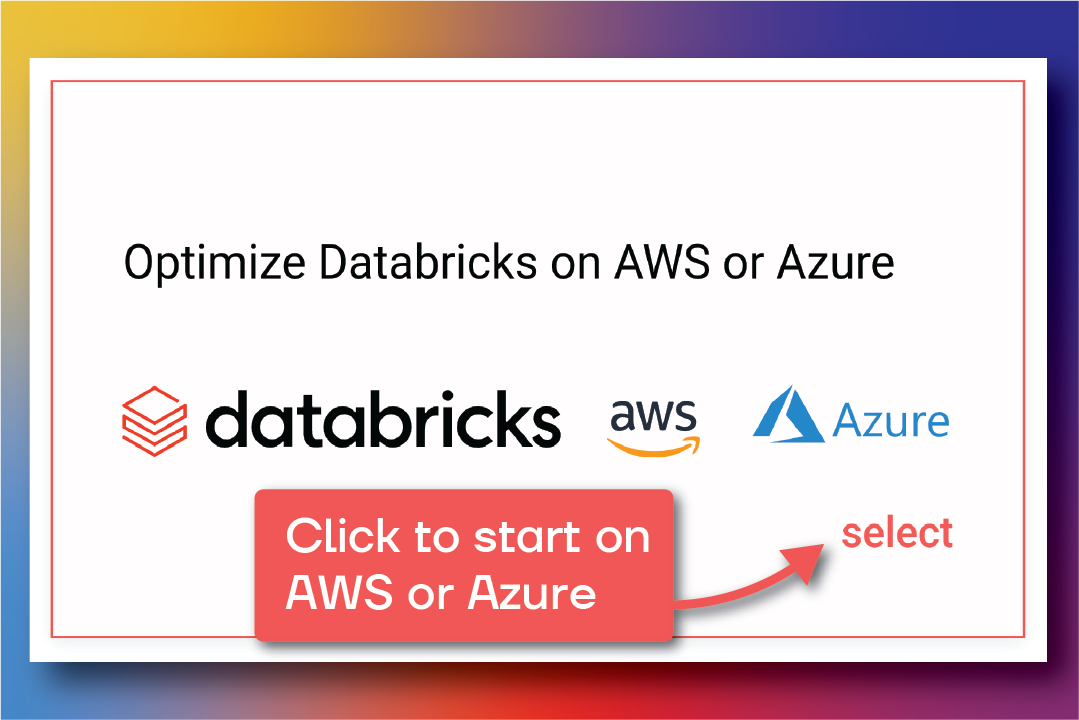
Azure support – A large percentage of Databricks users are on Azure, and obviously they wanted us to support them
Those features requests weren’t small and required pretty substantial changes from the backend to the front, but at the end of the day we couldn’t agree more with the feedback. While a sane company would prioritize and tackle these one by one, we knew each one of these were actually interrelated behind the scenes, and it wasn’t just a simple matter of checking off a list of features.
Here’s our high level demo video to see the new features in action!
So we took the challenge head on and said “let’s do all of it!” With all of that in mind, let’s walk through each awesome new features!
Feature #1: See Gradient’s ROI with cost and runtime Visualizations
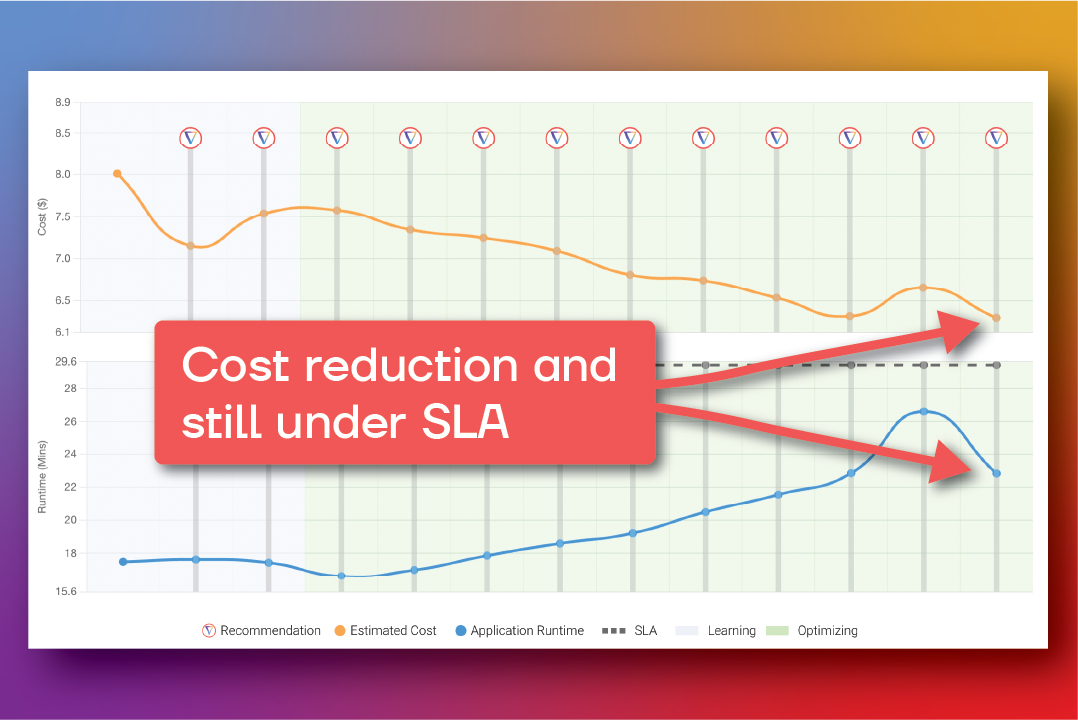
With new timeline graphs users can see in real-time the performance of their jobs and what impact Gradient is having. As a general monitoring tool, users can now see the impact of various cloud anomalies on their cost and runtime. A summary of benefits is below:
Monitor your jobs total costs across both DBUs and cloud fees in real-time to stay informed
Ensure your job runtimes and SLAs are met
Learn what anomalies are impacting your jobs’ performances
Visualize Gradient’s value in by watching your cost and runtime goals being met
Feature #2: Cluster integrations with AWS and Azure
Gradient now interfaces with both AWS and Azure cloud infrastructure to obtain low level metrics. We know many Databricks enterprises utilize Azure and this was a highly requested feature. A summary of benefits is below:
Granular compute metrics are obtained by retrieving cluster logs beyond what Databricks exposes in their system tables
Integrate with Databricks Workflows or Airflow to plug Gradient into how your company runs your infrastructure
Easy metrics gathering as Gradient does the heavy lifting for you and automatically compiles and links information across both Databricks and cloud environments
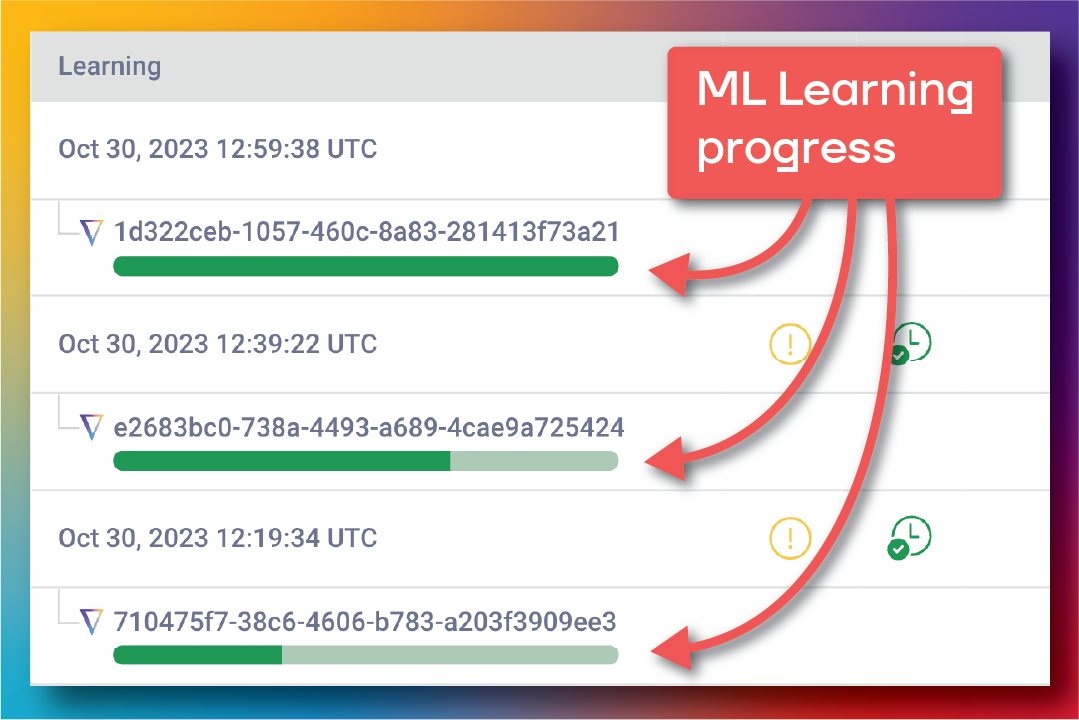
Feature #3: A new machine learning algorithm that custom learns each job
A huge upgrade from our previous solution is a new machine learning algorithm that learns the behavior of each job individually before optimizing. One lesson we learned is each job is unique, from python, to SQL, to ML, to AI, the variety of codebases out there is massive. A blanket “heuristic” solution was not scalable, and it was clear we needed something far more intelligent. A summary of the benefits is below:
Historical log information is used to train custom models for each of your jobs. Since no two jobs are alike, custom models are critical to optimizing at scale.
Accuracy is ensured by training on real job performance data
Stability is obtained with small incremental changes and monitoring to ensure reliable performance
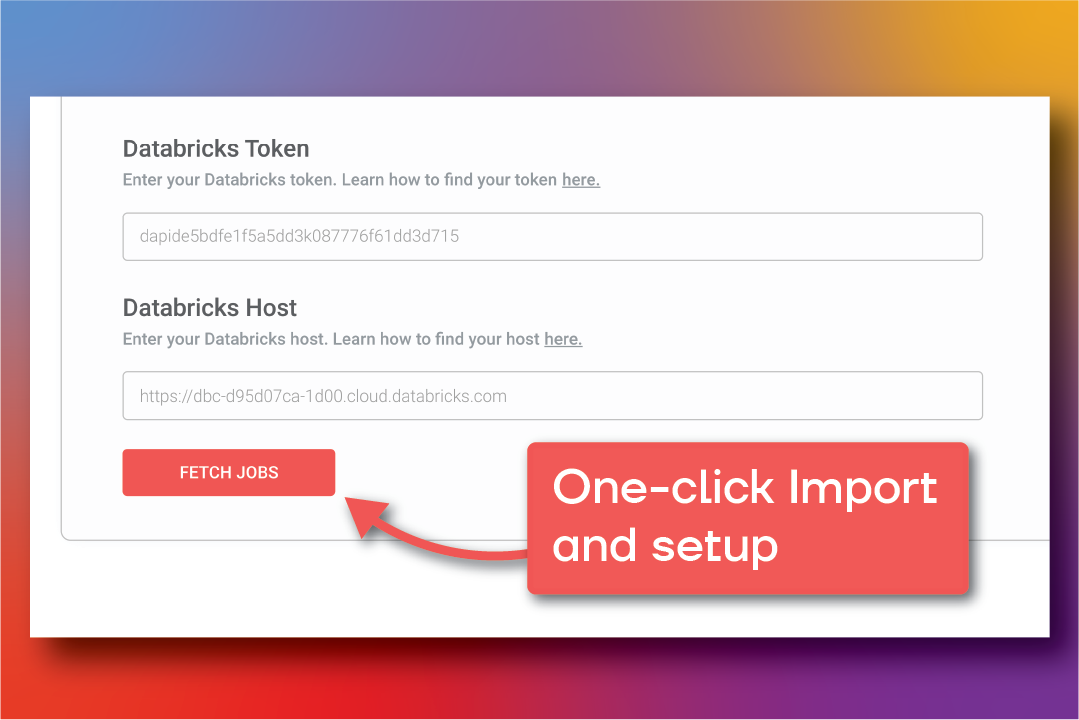
Feature #4: Auto-import and setup all of your jobs with a single click
Integrating with the Databricks environment is not easy, as most practitioners can attest to. We invested a lot of development into “how do we make it easy to on-board jobs?” After a bunch of work and talking to early users – we’ve built the easiest system we could find – just push a button.
Behind the scenes, we’re interacting with the Databricks API, tokens, secrets, init scripts, webhooks, logging files, cloud compute metrics, storage – just to name a few. A summary of the benefits is below:
Gradient connects to your Databricks workspace behind the scenes to make importing and setting up job clusters as easy as a single click
Non-invasive webhook integration is used to link your environment with Gradient without any modifications to your code or workflows
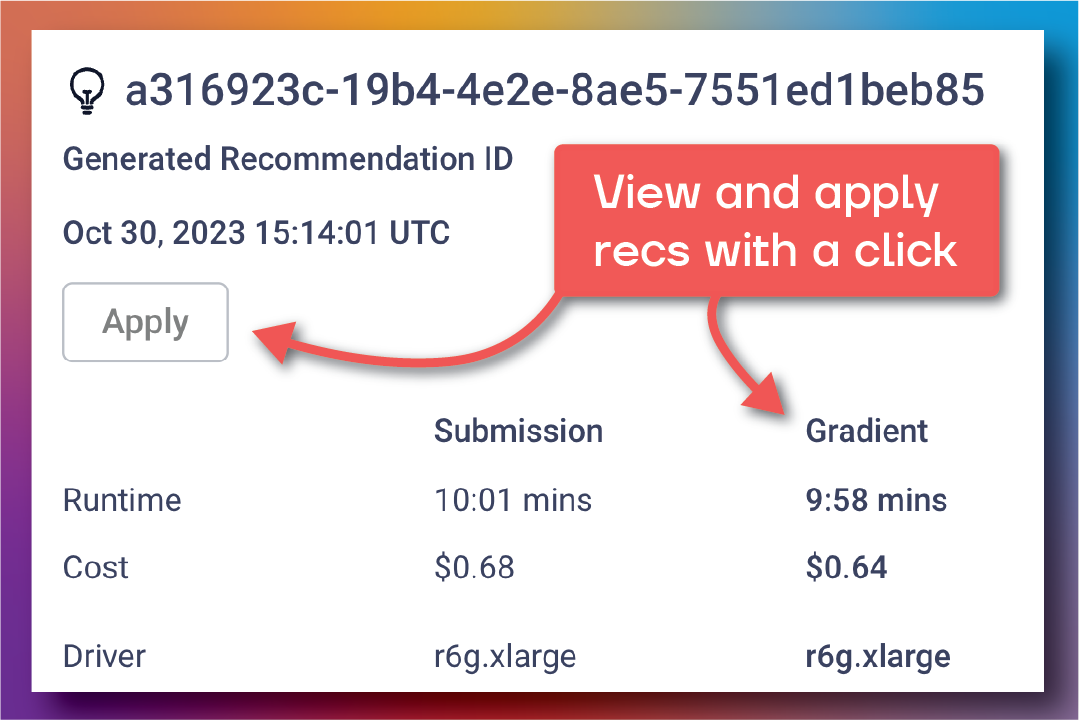
Feature #5: View and approve recommendations with a click
With all of the integration setup done in the previous feature, applying recommendation is now a piece of cake. Just click a button and your Databricks jobs will be automatically updated. No need to go into the DB console or change anything in another system. We take care of all of that for you! A summary of the benefits is below:
View recommendations in the Gradient UI for your approval before any changes are actually made
Click to approve and apply a single recommendation so you are always in control
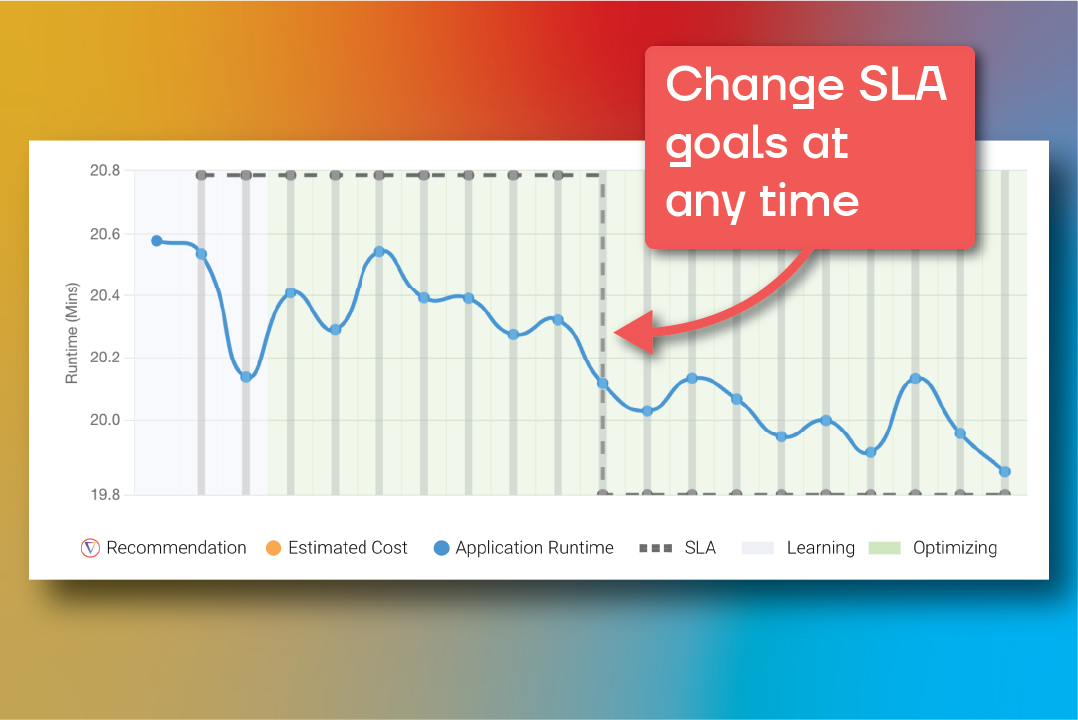
Feature #6: Change your SLA goals at any time
We always believed that business should drive infrastructure, not the other way around. Now you can change your SLA goals at anytime and Gradient will change your cluster settings to meet your goals. With the new visualizations, you can see everything changing in real time as well. A summary of the benefits is below:
Runtime SLA goals ultimately dictate the cost and performance of your jobs. Longer SLAs can usually lead to lower costs, while shorter SLAs could lead to higher costs.
Goals change constantly for your business, Gradient allows your infrastructure to keep up at scale
Business lead infrastructure allows you to start with your business goals and work backwards to your infrastructure, not the other way around
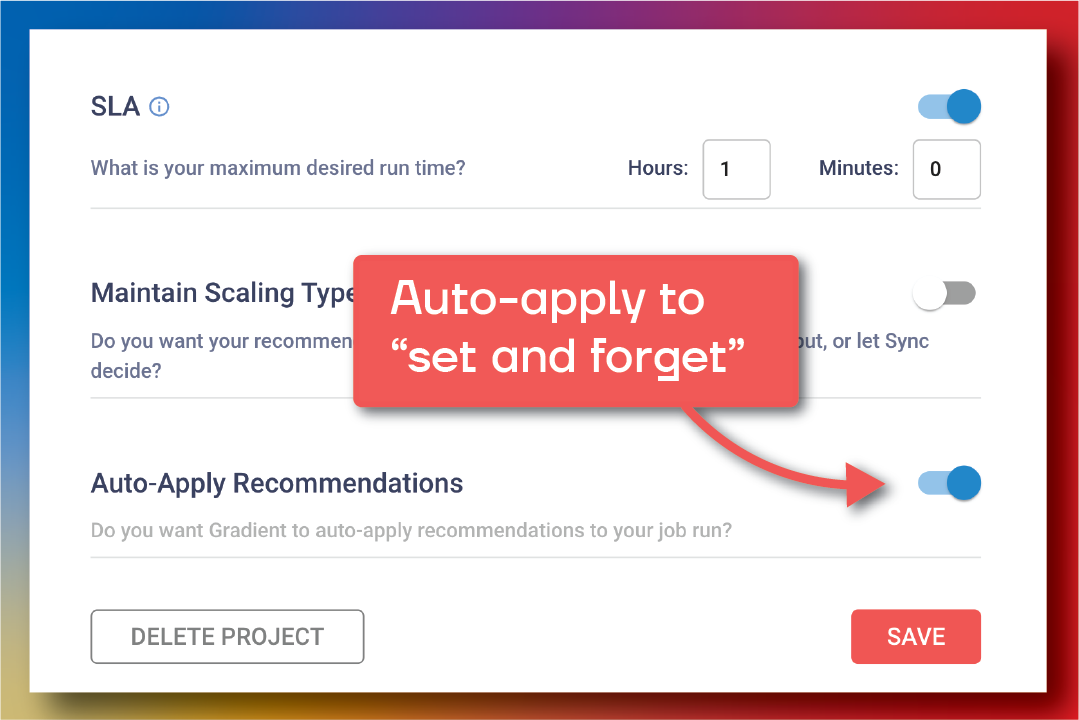
Feature #7: Enable auto-apply for self-improving jobs
One big request was for users at scale, who have hundreds or thousands of jobs. There’s no way someone would want to click an “apply” button 1000x a day! So, for our ultimate experience, we can automatically apply our recommendations and all you have to do is sit back and watch the savings. A summary of the benefits is below:
Focus on business goals by allowing Gradient to constantly improve your job clusters to meet your ever changing business needs
Optimize at scale with auto apply, no need to manually analyze individual jobs – just watch Gradient get to work across all of your jobs
Free your engineers from manually tweaking cluster configurations and allowing them to focus on more important work
Try it yourself!
We’d love to get your feedback on what we’re building. We hope these features resonate with you and your use case. If you have other use cases in mind, please let us know!
Databricks recently released System Tables, to help users understand and monitor their usage. They also had the older and more skunk works project called Overwatch, which also provides usage and infrastructure information. So what’s the difference between the two? When should I use either one? Let’s dive in!
Introduction
Databricks as a whole is a complex ecosystem from both technical compute intricacies to confusing pricing structures. As a user, you likely have questions such as: What are my spark jobs doing? How high is my utilization and is it efficient? Who are the other users on my account and what are their compute costs? Which tables are they accessing?
Databricks currently has two tools that people can use to help answer these questions and monitor metrics. The first, and older one, is called Overwatch, and the other is the more recently released product System Tables. There are some pros and cons of both platforms, and we’ll walk through the points we found relevant below:
High level overview
Overwatch: Was developed internally within the Databricks Labs, and was released several years ago. It’s an open source side project, vs. a polished product out of Databricks.
Pros: Overwatch provides many metrics, from low level Spark event metrics to cost data – we recommend viewing their docs to see more details as to what metrics it surfaces. Since it’s open source, it’s incredibly customizable and can work in real-time.
Cons: It’s very complicated to set up, especially the real-time monitoring service. This is not an easy tool to use, and likely only for advanced Databricks users. While it contains a lot of data, it is difficult to extract actionable insights from the data without Spark expertise. Users also accrue compute costs to host Overwatch (admittedly it seems like a small overhead cost relative to your total Databricks costs).
System Tables: An official product out of Databricks launched in 2023, and has a focus on high level usage, costs, and access.
Pros: It’s fully integrated with their Unity catalog, and users can get up and running pretty quickly within the Databricks platform. It is more geared for analyzing usage and cost information.
Cons: It is less focused on low level Spark metrics, which means it will be less useful if you’re looking for a tool to help you optimize your code. One other big note is System tables is not a real-time service, data is only updated several times a day (as of the date of this blog). One other note, System tables doesn’t seem to feed in your cloud costs, and only reports on DBU costs – this is a bit disappointing since cloud costs can often be greater than your DBU costs.
What information is monitored?
Overwatch – The full and official list of the parameters monitored can be found on their docs page. The broad categories are Databricks workflows, compute, Spark UI, Databricks SQL, and security. For a more opinionated view of what information they provide, I recommend checking out their pre-built dashboards page which describes popular metrics to track. I also recommend seeing their scopes and modules page to see the granular Spark metrics that are reported. Since there are more similarities than differences between the two systems, let’s identify what’s unique in Overwatch and not in System Tables:
System Tables – The list of information provided by System Tables can be found on their main page. At the highest level there are several tables provided today: audit logs, billable usage logs, pricing table, table and column lineage, and marketplace listing access. Some of the unique pieces of information that System tables have is:
Data lineage
System Access
Marketplace pricing
What is the setup process like?
Overwatch – The main instructions for installing Overwatch can be found on the deploy page. To say the least, it’s complicated. It requires you to configure your cloud, security, secrets, audit logs, and a host of other options. One thing we also found was if you did want to pipe in your actual cloud costs, the user has to do a lot of pipeline building to feed your cloud cost information to Overwatch. If a user wants to collect real-time cluster metrics, the user will have to write a script to collect the metrics and set up a time-series database.
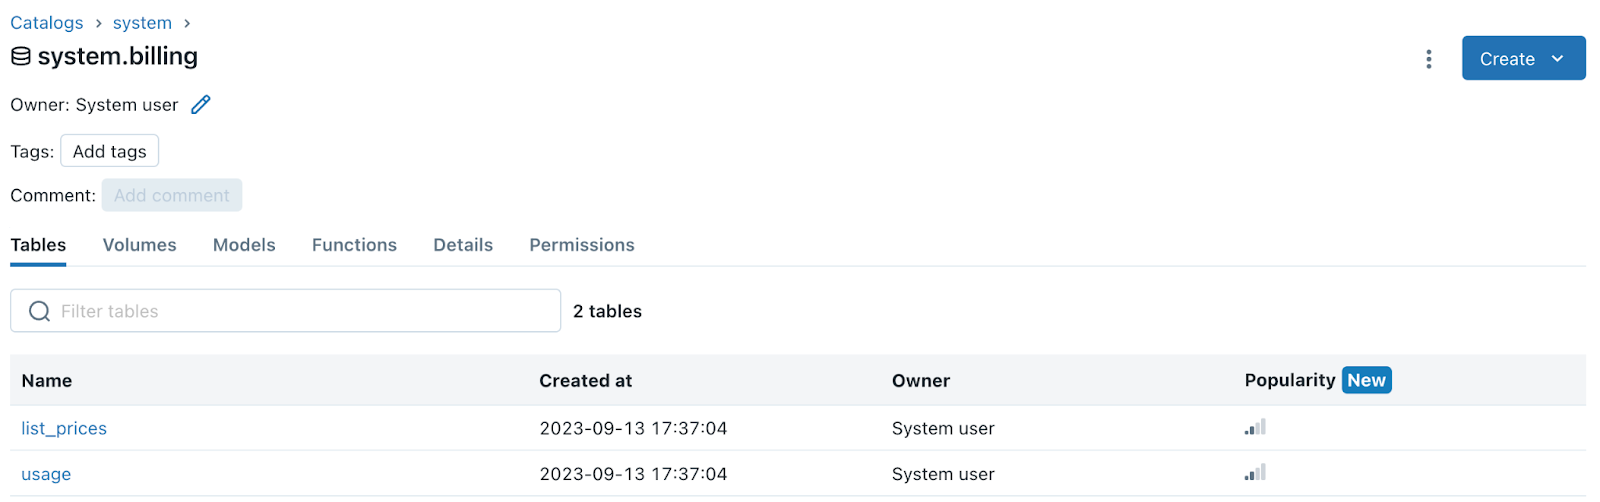
System Tables – Enabling system tables is pretty easy, you do need to have at least one unity-catalog enabled workspace. System tables must be enabled by an account admin. You can enable system tables using the Unity Catalog REST API. Once enabled, the tables will appear in a catalog called system, which is included in every Unity Catalog metastore. In the system catalog you’ll see schemas such as access and billing that contain the system tables.
What are some use cases?
Common Use Cases
Monitoring Databricks costs – Break down your costs by user, tags, notebook, job, etc.
Finding the “expensive” jobs – Locate cost hotspots and identify who is responsible.
Overwatch
Low level Spark metrics to optimize code – An expert user can inspect the detailed Spark job information that overwatch surfaces (i.e. task, stage, executor metrics, etc.) to design an optimization plan specific to their jobs.
Real-time cluster information for monitoring – Users can check the utilization of their clusters and make case-by-case decisions on cluster and instance sizing, for example.
System Tables
Monitoring who is accessing which table
Monitoring usage with specific tags
Viewing the lineage of my tables
What do neither of them do?
No actionable decisions – Both of these systems surface excellent and useful information for companies to review. However, there is always the question of “what do I do with this data?” That is still left for the user to decide what to do – as there are plenty of great options. So if users are looking for a solution that goes beyond monitoring and dashboards, they’ll need to look elsewhere.
No job optimizations – Neither platform actually optimizes your jobs, they simply report metrics. They can help flag problematic jobs, but then a human engineer is still required to go in and optimize things. Whether or not companies have bandwidth to send an engineer to go chasing random problems here and there is another question. While these platforms are great for identifying large hotspots, they aren’t great at optimizing a large number of jobs simultaneously.
Conclusion
Here at Sync, we are huge fans of both platforms. My opinion is the System Tables will eventually take over as the “real” product for monitoring Databricks usage, as it’s probably fairly trivial to add in the Spark metrics to system tables. So if I were a company aiming to invest in one or the other, i’d go with System tables. They are also massively easier to set up to get up and running.
However, the drawback of both platforms are both real – basically neither of them do any active optimization. That’s why we built Gradient, a closed-loop feedback system that continuously optimizes your Databricks jobs to hit your business goals. We built the missing intelligence that mines much of the same data as Overwatch, and provides automatic recommendations that data engineers can instantly apply.
Interested in learning more about Gradient to optimize your Databricks jobs? Reach out to Jeff Chou and the rest of the Sync Team.
Databricks is a popular unified analytics platform and a go-to solution for many organizations looking to harness the power of big data. Its collaborative workspaces have become the industry standard for data engineering and data science teams and an ideal environment for building, training and deploying machine learning and AI models at scale.
However—as with any cloud-based service— Databricks pricing structure is extremely complex and product dependent – understanding it is crucial for budgeting and cost management. In this article, we’ll explain in simple terms everything having to do with Databricks pricing, including its pay-as-you-go model, what factors affect your individual pricing, and examples of how to save on cost.
Databricks Pricing FAQ
How is my Databricks cost calculated?
What are the different Databricks pricing plans?
Price for Databricks by workload
Does Databricks offer free trials?
How to save money on Databricks
How do I find The cost of my Databricks?
Additional costs for running Databricks
How does Databricks price compare to Snowflake?
First off, what is the price of Databricks?
The short answer is that it depends. As we’ll explain below Databrick’s price depends on usage so there is no single answer to what it costs. However, based on the average data use of a medium-sized company, it’s fairly normal to see an expenditure of a midsize company to be somewhere between $100k to $1 million per year.
How is my Databricks cost calculated?
In simple terms, Databricks cost is based on how much data you process, and the type of workload you’re executing and which product you’re using. Each type of compute has a different price per processing unit—known as Databricks unit, or DBU. To calculate your Databricks cost, you simply multiply the number of DBUs used by the dollar rate per DBU for that workload.
For instance, certain jobs such as Jobs Light Compute or Serverless Real-Time cost $0.07 per DBU. So if you use a job that requires 100 DBU it would cost $7.00.
Keep in mind complex tasks such as All-Purpose Interactive workloads (typically used for data science or business intelligence) have higher costs of around $0.55 per DBU. This means that it’s not just the amount of data, but also the workload type. Data velocity (the frequency your data pipeline is used) and data complexity (how much work it takes to process your data set) can all add to the amount of DBUs needed, and thus raise the cost of your workload. It’s thus crucial to evaluate your ETL workflow before and during your Databricks subscription to understand if there are areas for optimization.
Outside of the job function itself, prices for your Databricks subscriptions differ by cloud service provider, your pricing plan, and even your region (though within the contiguous U.S these prices are largely the same). Databricks price can also differ by size and type of instance, which refers to the type of virtual machine you are running on the Databricks lakehouse.
In addition to Databricks costs, there can also be the cloud compute costs. For example, if you run a job on a cluster, you have to pay for both the Databricks overhead as well as the cloud compute costs. Typically the cloud compute costs can be larger than your Databricks cost, so keep this in mind. As a result, the total cost of Databricks is a sum of two major components:
Total Cost of Ownership = Databricks Cost + Cloud Provider Cost
What is interesting, is both the Databricks and cloud costs scale with the cluster size. While that does make sense from the cloud provider’s perspective, since they are providing the compute — one may ask:
Why do Databricks costs scale with cluster size when they don’t run my cluster?
In reality, Databricks is a software layer on top of your cloud provider. Whether you run a 1 node cluster, or a 1000 node cluster, the actual costs to Databricks is fixed. While this doesn’t make any sense, that’s the reality of Databricks pricing.
What are the different Databricks pricing plans?
At the moment there are three different types of pricing plans: Standard Plans, Premium Plans, and Enterprise Plans. These plans differ in their features and types of workloads available, with Premium plan costing the same or more than Standard plan.
Much of the premium plan’s benefit is for role-based access control (think assigning admins with more capabilities and permissions than users), and for higher levels of automation and authentication. There is also access to features like Audit Logs, Credential Pass Through (for Azure Databricks), and IP access list. Enterprise plans are customized per user so vary based on company size, contract size, and duration of the plan.
For a full list of differences between standard and premium pricing, check out here.
Price for Databricks by Workload
Below you will see a breakdown of Databricks cost by workload for the standard plan, using AWS as Cloud Service Provider and in the Central US region.
Jobs Compute
Jobs Lite Compute: $.0.07 per DBU/hour
Jobs Compute: $0.10 per DBU/hour
Jobs Compute Photon: $0.10 per DBU/hour
Delta Live Tables
DLT Core Photon: $0.20 per DBU/hour
DLT Pro Photon: $0.25 per DBU/hour
DLT Advanced Photon: $0.36 per DBU/hour
All Purpose Compute:
All Purpose Comptute: $0.40 per DBU/hour
All Purpose Compute Photon: $0.40 per DBU/hour
The following workloads are only available for premium subscriptions, and so their prices reflect as such.
Serverless and SQL Compute:
SQL Classic: $0.22 per DBU/hour
SQL Pro: $0.55 per DBU/hour
SQL Severless: $0.70 per DBU/hour
Serverless Real-time Inference: $.0.07 per DBU/hour
Does Databricks offer free trials?
Yes, Databricks does offer free trials, with a free version with fully usable user-interactive notebooks available for 14 days. While the Databricks trial itself is free, you still need to pay for the underlying cloud infrastructure.
If you want to continue to use Databricks for free (but with limited features) you can use the open-source Databricks Community Edition. This is great for those wanting to learn Apache Spark.
However, it’s also important to note that because there are no upfront costs and Databricks is priced on a pay-as-you-go model, the cost itself to get set up is very minimal.
How To Save Money On Databricks
The great news about the Databricks pricing model is that because it’s based on usage, there are a number of ways to reduce your cost basis by altering your usage. Some of these ways include:
Optimize Your Job Clusters. By choosing the right size and type job cluster, companies can often save huge amounts of money through runtime reductions, without having to make any changes to hardware. For instance, Sync saved DuoLingo 55% on their machine learning costs simply through cluster optimization.
Use Spot Instances. This is for AWS customers specifically, “Spot Instances” are unused computing capacity on Amazon EC2, which are offered up at deep discounts of up to 90%. However, one of the issues with Spot instances is that machines (or worker nodes) can be removed at any time. This can cause unwanted delays in your job, which can end up increasing the cost of your job. So while Spot Instance wil save you money most of the time, if you need reliable runtime and performance more than costs – then on-demand instances may be better.
Use Photon. Photon is the next-generation engine on the Databricks Lakehouse Platform that provides massively parallel, extremely fast query performance at lower total cost. This makes it very efficient for highly complex workloads, but maybe overkill for certain simple jobs that are not Photon compatible. If your job is not compatible you could end up paying 2x the DBU costs for no benefit. So we recommend testing your job with Photon to see if you get cost savings or not. Read our blog on this topic to learn more.
Autoscaling. Autoscaling is a Databricks configuration that helps to dynamically tune the number of workers for your workloads. Activating autoscaling is a simple checkbox in the databricks UI that many people overlook. However, there is a cost to spinning up and down nodes where you’re paying for machines that are still warming up and not actually processing data. This makes autoscaling best for ad-hoc notebook usage. However, for production static Jobs, Autoscaling may end up costing more. Read our blog on this topic to learn more.
Optimize your code. Apache Spark is a very rich programming framework, and Databricks has built a lot of optimizations within their platform. For example: Optimize & Z-order, OptimizeWrite, Partitioning, File size tuning, Reduce shuffle, Cost based optimizer, Adaptive Query Engine, Salting, Data Skipping, Delta Lake optimizations, and Data Caching. A lot of these techniques are very advanced, but thankfully Databricks has a great resource outlining best practices.
Don’t use Databricks. Databricks is great for many use cases, but it is very expensive. A lot of real world use cases don’t have data sizes at scale to really justify using Databricks. There are alternative Apache Spark services, such as AWS EMR or using free open source Apache Spark. These options are usually more time intensive to set up, which may mean you need more infrastructure engineers – however their per minute costs are typically cheaper.
Additionally, there are some subscription parameters you can alter to maximize your savings when it comes to using Databricks. The major ones here include:
Committed Use Discounts. Databricks offers big discounts for those who pre-pay for their processing units, in what’s known as Databricks Commit Units (DBCU). Like many things, the more DCBUs you buy the more you save. For instance, a customer buying $25,000 worth of DBCUs per year could save 6%, while one buying $1.25 million could save as much as 33%. See a full list of pre-purchase discounts for Azure here.
Use A Different Cloud Service Provider. There are three different cloud service providers for Databricks: AWS, Microsoft Azure and Google Cloud. In our experience, Azure is the most expensive of these, roughly 1-2x higher per DBU than the other two (this is due to the Databricks being a first-party service and having included support from Microsoft).
How Do I Find The Cost Of My Databricks?
Finding the total cost of your databricks usage can be tricky. Because pricing is based on both the Databricks and Cloud provider fees, it’s difficult to collect and attribute all of the costs. There are several methods you can use depending on what you can access at your company:
1. First Find DBUs
You’ll always want to first asses the direct cost of your Databricks usage. To do this you can go to your admin page, and look at your data usage to isolate just your DBU costs. You can also go the new “system tables” under Databricks which will breakdown the DBU costs only for your jobs.
2. Find Cloud Provider Costs
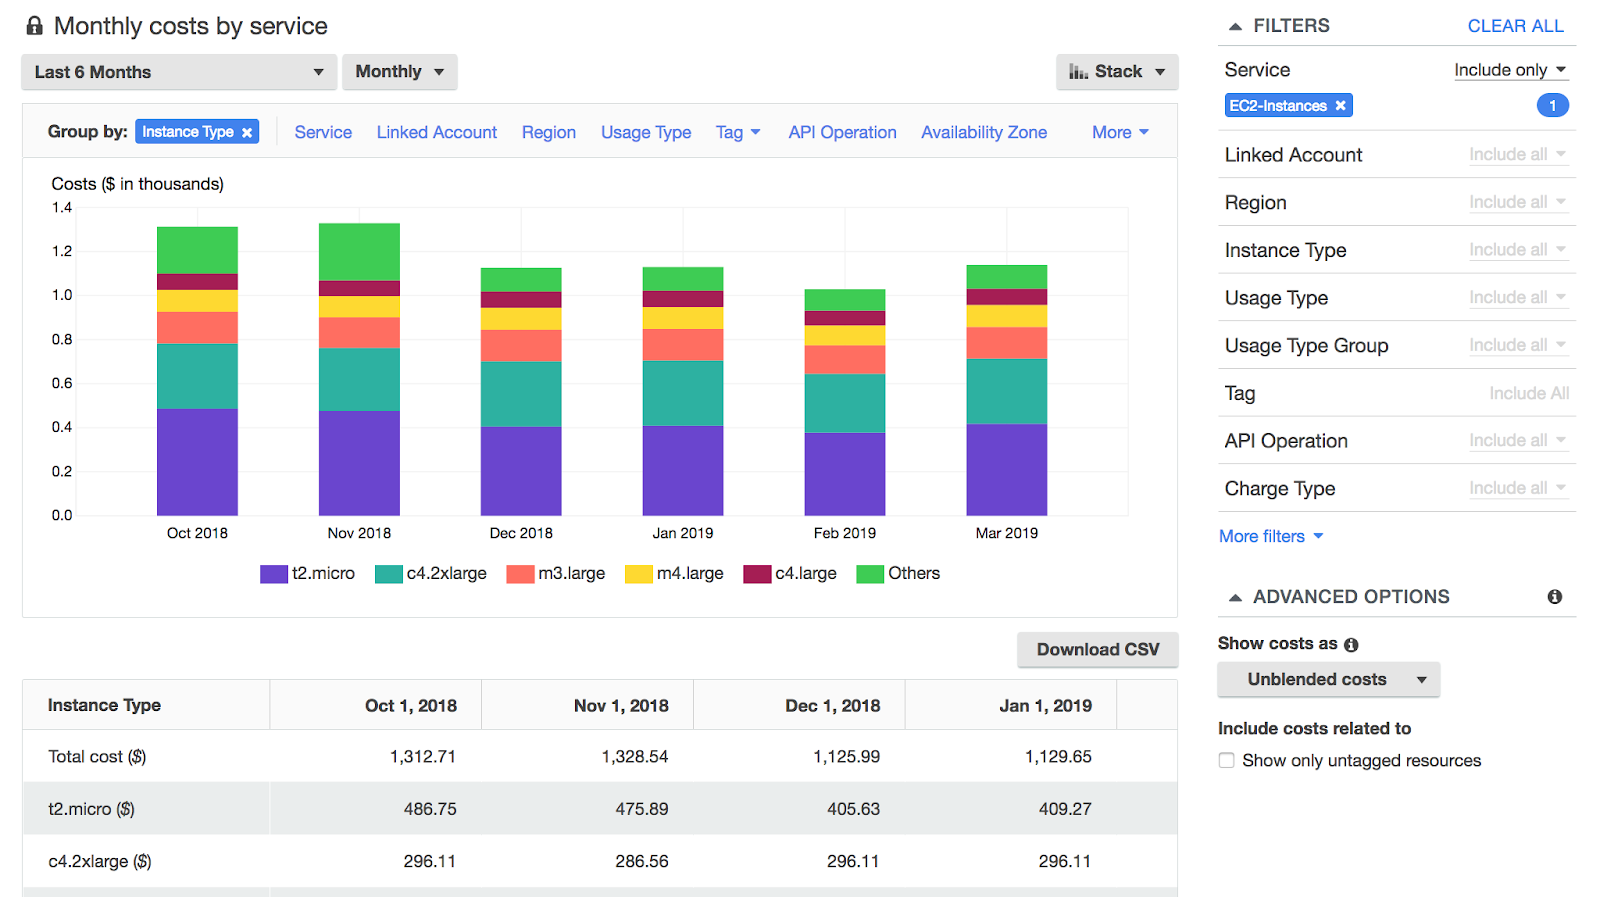
The good news about Cloud provider costs is that they should remain fairly static relative to Databricks costs. To find your Cloud Provider cost, you should be able to use the tags employed inside your Databricks clusters to find associated costs within your Cloud Provider account. For example, example in AWS, you can use costs explorer to find the cluster and tags associated with your bill.
One thing to note is that it can take from several hours to a day to wait for the billing information to be placed in both Databricks or your cloud providers endpoints. This means you have to match costs to workflows from given days, and you can’t get real time results on costs.
Real-time Estimated Total Costs with Gradient
Due to the complexities of extracting the actual cost of each workload, we put together our Gradient product to estimate the total cost (DBUs + cloud costs) of each of your jobs. These costs are estimated based on the Spark eventlog and the cluster metrics from your cloud provider.
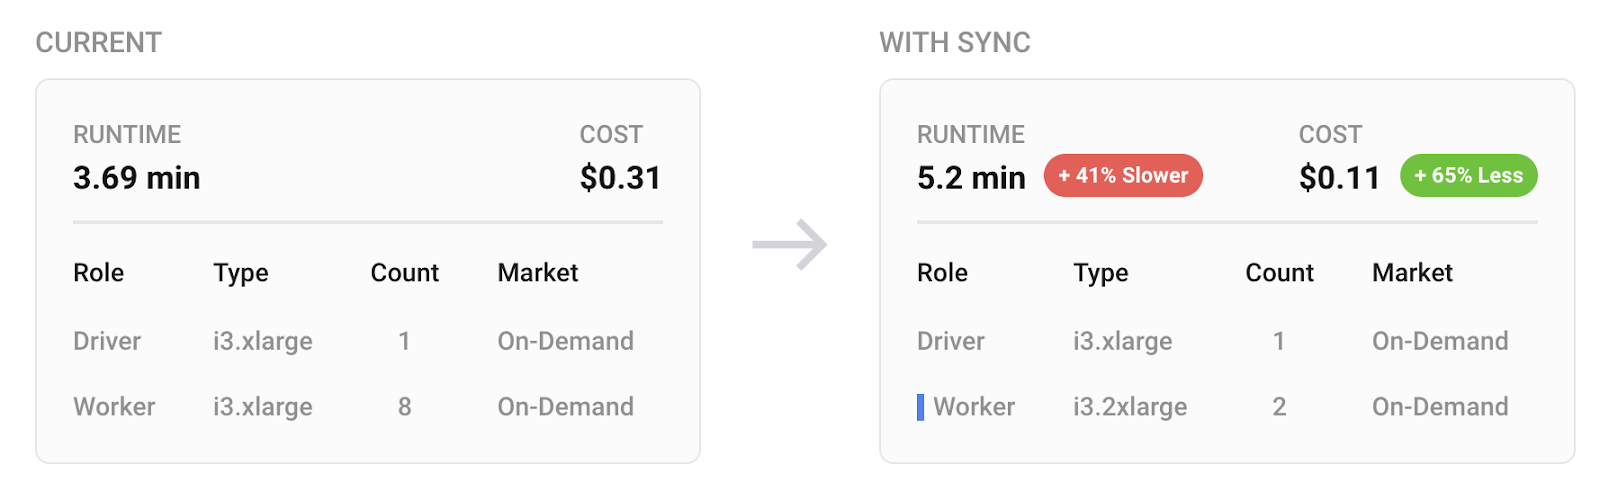
In the image below from Gradient, we can see the runtime and the estimated total cost of the job before and after a sync recommendation. These cost values are provided instantly after each job run. Of course they are only estimates and baked on list-pricing – but it will give you a good idea of cost trends.
Additional Costs For Running Databricks
Apart from workspace and compute costs, there are other factors to consider:
Data Migration and Storage: While Databricks itself doesn’t charge for data storage, you might incur costs based on the cloud provider’s storage and data transfer rates. Databricks also offers a data migration service from existing data warehouse.
Third-party Integrations: Databricks offers intelligent lakehouse monitoring provided by Unity Catalog, and Predictive Optimization powered by AI. Both operate under a DBU/hour model like standard pricing.
Support and Training: Databricks offers various support and training packages, which come at an extra cost. Databricks public instructor-led courses average $1,000 to $1,500 per participant (though you can 20% for a limited time with the discount code ilt20)
How Does Databricks Price Compare To Snowflake?
While Databricks is a fairly unique product, the most common alternative companies consider is Snowflake. While both are cloud-based data solutions, Databricks is much more common for large-scale machine learning and data science jobs, whereas Snowflake is optimized for low-to-moderate SQL-based queries. Snowflake is typically easier to use, however, users have much less fine grain control of their infrastructure.
While both have a usage-based charge Snowflake charges clients directly for everything – from compute to storage. Databricks on the other hand has 2 cost drivers, Databricks fees in addition to Cloud compute / storage fees.
At the end of the day, there’s no real way to predict if either platform will be cheaper. It all depends on how you use it and what kind of workloads you’re running. One comment we can say is, you’ll only get as much efficiency as effort you put in – as both platforms require optimizations.
As data teams scale up on the cloud, data platform teams need to ensure the workloads they are responsible for are meeting business objectives. At scale with dozens of data engineers building hundreds of production jobs, controlling their performance at scale is untenable for a myriad of reasons from technical to human.
The missing link today is the establishment of a closed loop feedback system that helps automatically drive pipeline infrastructure towards business goals. That was a mouthful, so let’s dive in and get more concrete about this problem.
The problem for data platform teams today
Data platform teams have to manage fundamentally distinct shareholders from management to engineers. Oftentimes these two teams have opposing goals, and platform managers can be squeezed by both ends.
Many real conversations we’ve had with platform managers and data engineers typically go like this:
“Our CEO wants me to lower cloud costs and make sure our SLAs are hit to keep our customers happy.”
Okay, so what’s the problem?
“The problem is that I can’t actually change anything directly, I need other people to help and that is the bottleneck”
So basically, platform teams find themselves handcuffed and face enormous friction when trying to actually implement improvements. Let’s zoom into the reasons why.
What’s holding back the platform team?
Data Teams are out of technical scope – Tuning clusters or complex configurations (Databricks, Snowflake) is a time consuming task where data teams would rather be focusing on actual pipelines and SQL code. Many engineers don’t have the skillset, support structure, or even know what the costs are for their jobs. Identifying and solving root cause problems is also a daunting task that gets in the way of just standing up a functional pipeline.
Too many layers of abstraction – Let’s just zoom in on one stack: Databricks runs their own version of Apache Spark, which runs on a cloud provider’s virtualized compute (AWS, Azure, GCP), with different network options, and different storage options (DBFS, S3, Blob), and by the way everything can be updated independently and randomly throughout the year. The amount of options is overwhelming and it’s impossible for platform folks to ensure everything is up to date and optimal.
Legacy code – One unfortunate reality is simply just legacy code. Oftentimes teams in a company can change, people come and go, and over time, the knowledge of any one particular job can fade away. This effect makes it even more difficult to tune or optimize a particular job.
Change is scary – There’s an innate fear to change. If a production job is flowing, do we want to risk tweaking it? The old adage comes to mind: “if it ain’t broke, don’t fix it.” Oftentimes this fear is real, if a job is not idempotent or there are other downstream effects, a botched job can cause a real headache. This creates a psychological barrier to even trying to improve job performance.
At scale there are too many jobs – Typically platform managers oversee hundreds if not thousands of production jobs. Future company growth ensures this number will only increase. Given all of the points above, even if you had a local expert, going in and tweaking jobs one at a time is simply not realistic. While this can work for a select few high priority jobs, it leaves the bulk of a company’s workloads more or less uncared for.
Clearly it’s an uphill battle for data platform teams to quickly make their systems more efficient at scale. We believe the solution is a paradigm shift in how pipelines are built. Pipelines need a closed loop control system that constantly drives a pipeline towards business goals without humans in the loop. Let’s dig in.
What does a closed loop control for a pipeline mean?
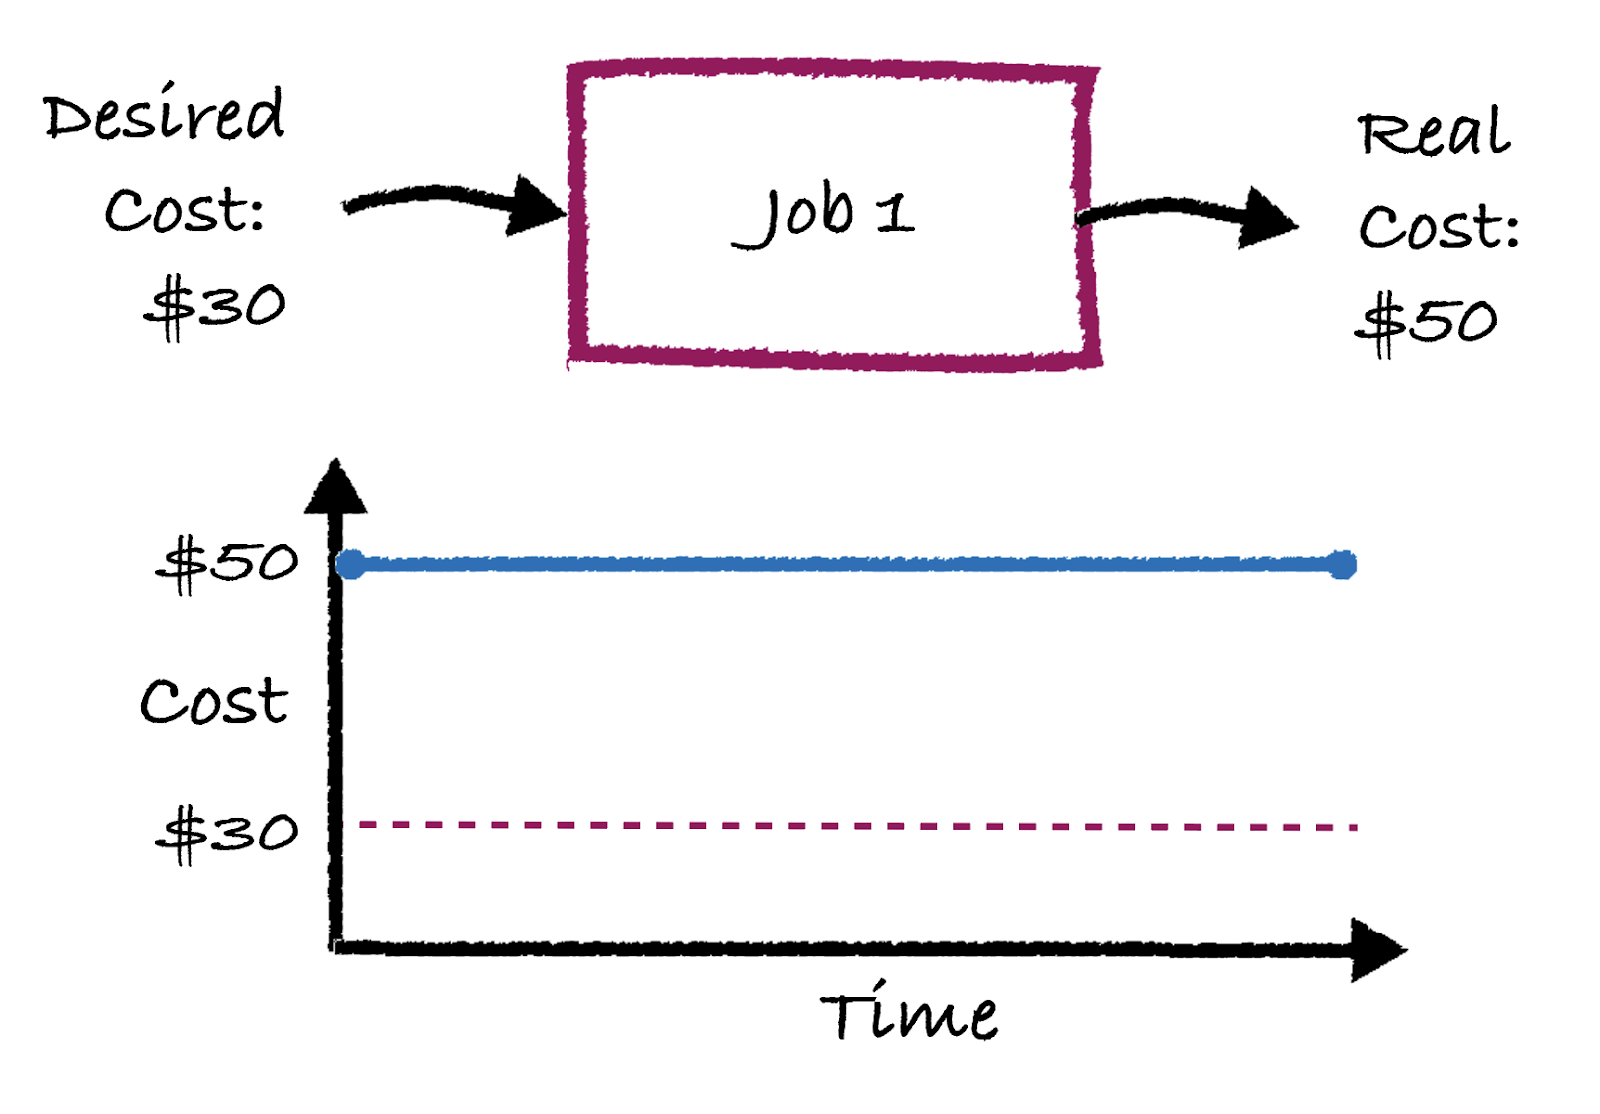
Today’s pipelines are what is known as an “open loop” system in which jobs just run without any feedback. To illustrate what I’m talking about, pictured below shows where “Job 1” just runs every day, with a cost of $50 per run. Let’s say the business goal is for that job to cost $30. Well, until somebody actually does something, that cost will remain at $50 for the foreseeable future – as seen in the cost vs. time plot.
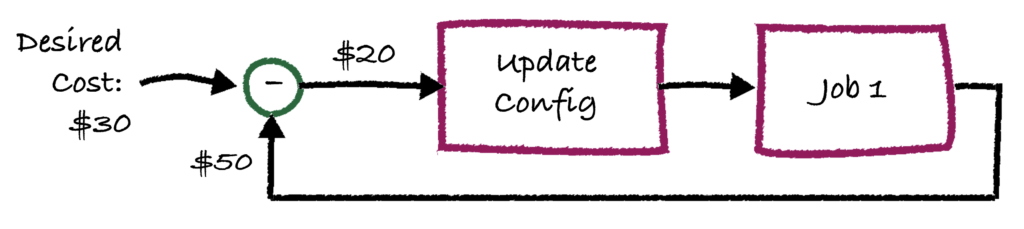
What if instead, we had a system that actually fed back the output statistics of the job so that the next day’s deployment can be improved? It would look something like this:
What you see here is a classic feedback loop, where in this case the desired “set point” is a cost of $30. Since this job is run every day, we can take the feedback of the real cost and send it to an “update config” block that takes in the cost differential (in this case $20) and as a result apply a change in “Job 1’s configurations. For example, the “update config” block may reduce the number of nodes in the Databricks cluster.
What does this look like in production?
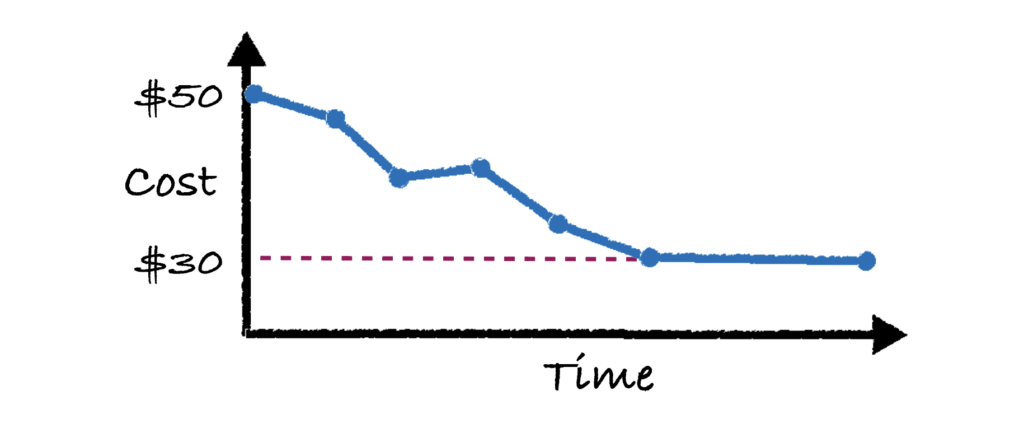
In reality this doesn’t happen in a single shot. The “update config” model is now responsible for tweaking the infrastructure to try to get the cost down to $30. As you can imagine, over time the system will improve and eventually hit the desired cost of $30, as shown in the image below.
This may all sound fine and dandy, but you may be scratching your head and asking “what is this magical ‘update config’ block?” Well that’s where the rubber meets the road. That block is a mathematical model that can input a numerical goal delta, and output an infrastructure configuration or maybe code change.
It’s not easy to make and will vary depending on the goal (e.g. costs vs. runtime vs. utilization). This model must fundamentally predict the impact of an infrastructure change on business goals – not an easy thing to do.
Nobody can predict the future
One subtle thing is that no “update config” model is 100% accurate. In the 4th blue dot, you can actually see that the cost goes UP at one point. This is because the model is trying to predict a change in the configurations that will lower costs, but because nothing can predict with 100% accuracy, sometimes it will be wrong locally, and as a result the cost may go up for a single run, while the system is “training.”
But, over time, we can see that the total cost does in fact go down. You can think of it as an intelligent trial and error process, since predicting the impact of configuration changes with 100% accuracy is straight up impossible.
The big “so what?” – Set any goal and go
The approach above is a general strategy and not one that is limited to just cost savings. The “set point” above is simply a goal that a data platform person puts in. It can be any kind of goal, for example runtime is a great example.
Let’s say we want a job to be under a 1 hour runtime (or SLA). We can let the system above tweak the configurations until the SLA is hit. Or what if it’s more complicated, a cost and SLA goal simultaneously? No problem at all, the system can optimize to hit your goals over many parameters. In addition to cost and runtime, other business use cases goals are:
Resource Utilization: Independent of cost and runtime, am I using the resources I have properly?
Energy Efficiency: Am I consuming the least amount of resources possible to minimize my carbon footprint?
Fault Tolerance: Is my job actually resilient to failure? Meaning do I want to over-spec it just in case I get preempted or just in case there are no SPOT instances available?
Scalability: Does my job scale? What if I have a spike in input data by 10x, will my job crash?
Latency: Are my jobs hitting my latency goals? Response time goals?
In theory, all a data platform person has to do is set goals, and then an automatic system can iteratively improve the infrastructure until the goals are hit. There are no humans in the loop, no engineers to get on board. The platform team just sets the goals they’ve received from their stakeholders. Sounds like a dream.
So far we’ve been pretty abstract. Let’s dive into a some concrete use cases that are hopefully compelling to people:
Example feature #1: Group jobs by business goals
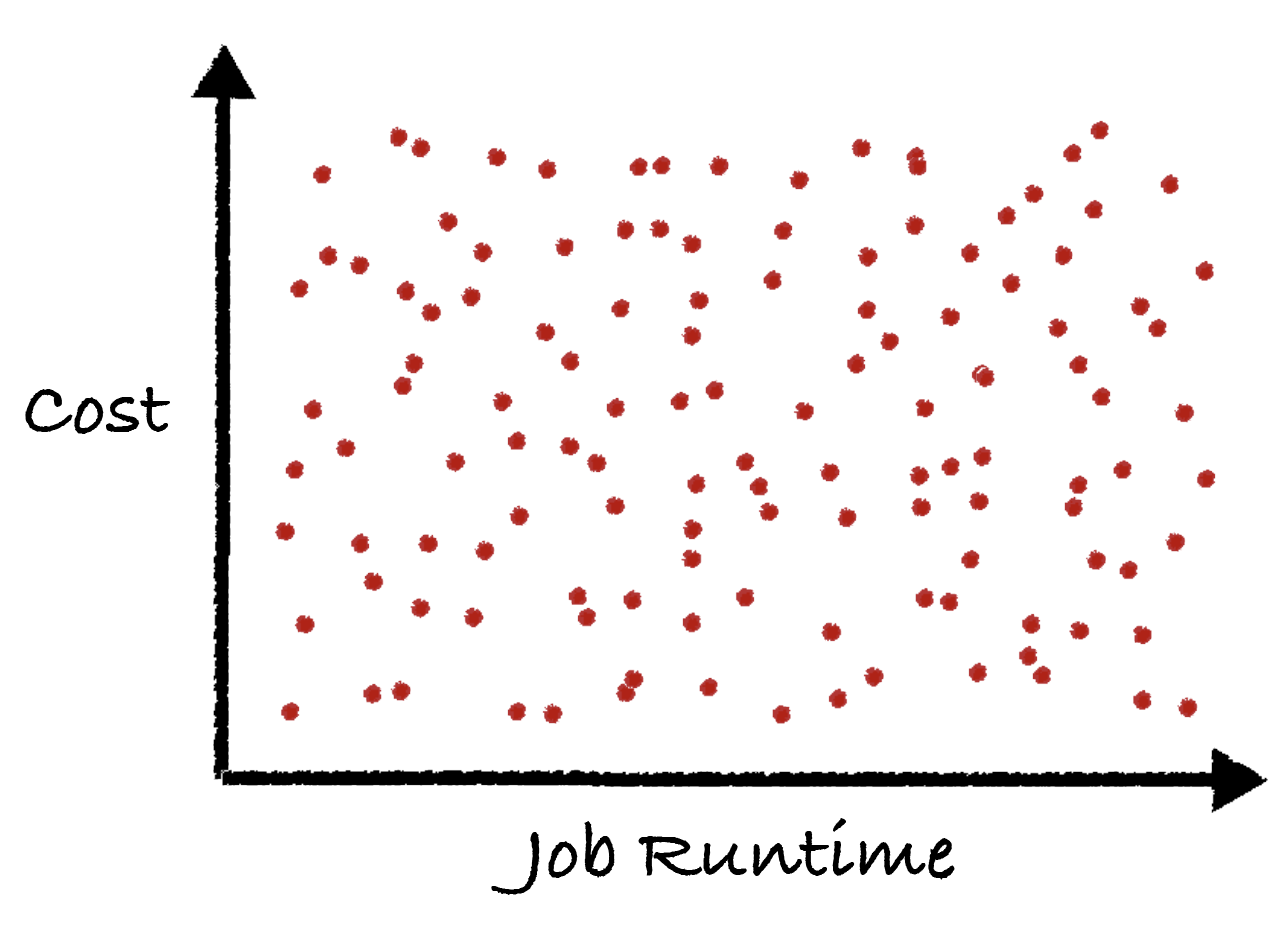
Let’s say you’re a data platform manager and you oversee the operation of hundreds of production jobs. Right now, they all have their own cost and runtime. A simple graph below shows a cartoon example, where basically all of the jobs are randomly scattered across a cost and runtime graph.
What if you want to lower costs at scale? What if you want to change the runtime (or SLA) of many jobs at once? Right now you’d be stuck.
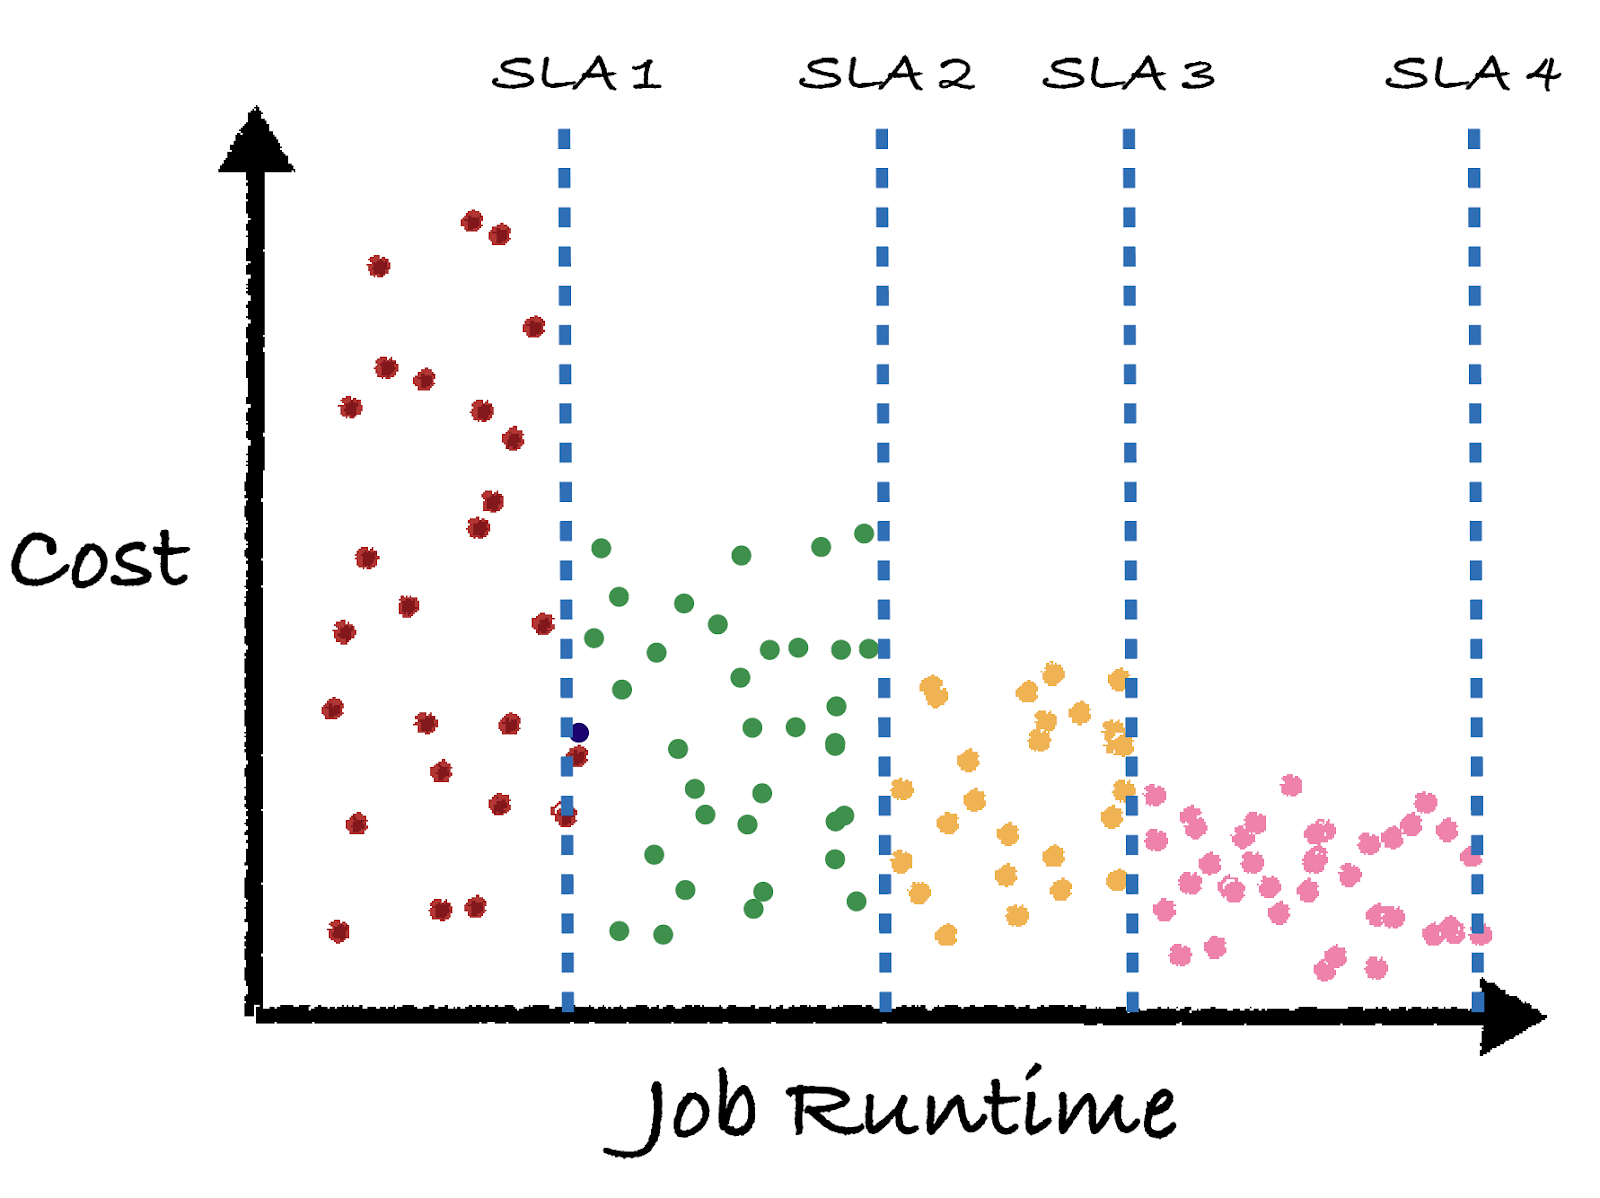
Now imagine if you had the closed loop control system above implemented for all of your jobs. All you’d have to do is set the high level business goals of your jobs (in this case SLA runtime requirements), and the feedback control system would do its best to find the infrastructure that accomplishes your goals. The end state will look like this:
Here we see each job’s color represents a different business goal, as defined by the SLA. The closed loop feedback control system behind the scenes changed the cluster / warehouse size, various configurations, or even adjusted entire pipelines to try to hit the SLA runtime goals at the lowest cost. Typically longer job runtimes lead to lower cost opportunities.
Example feature #2: Auto-healing jobs
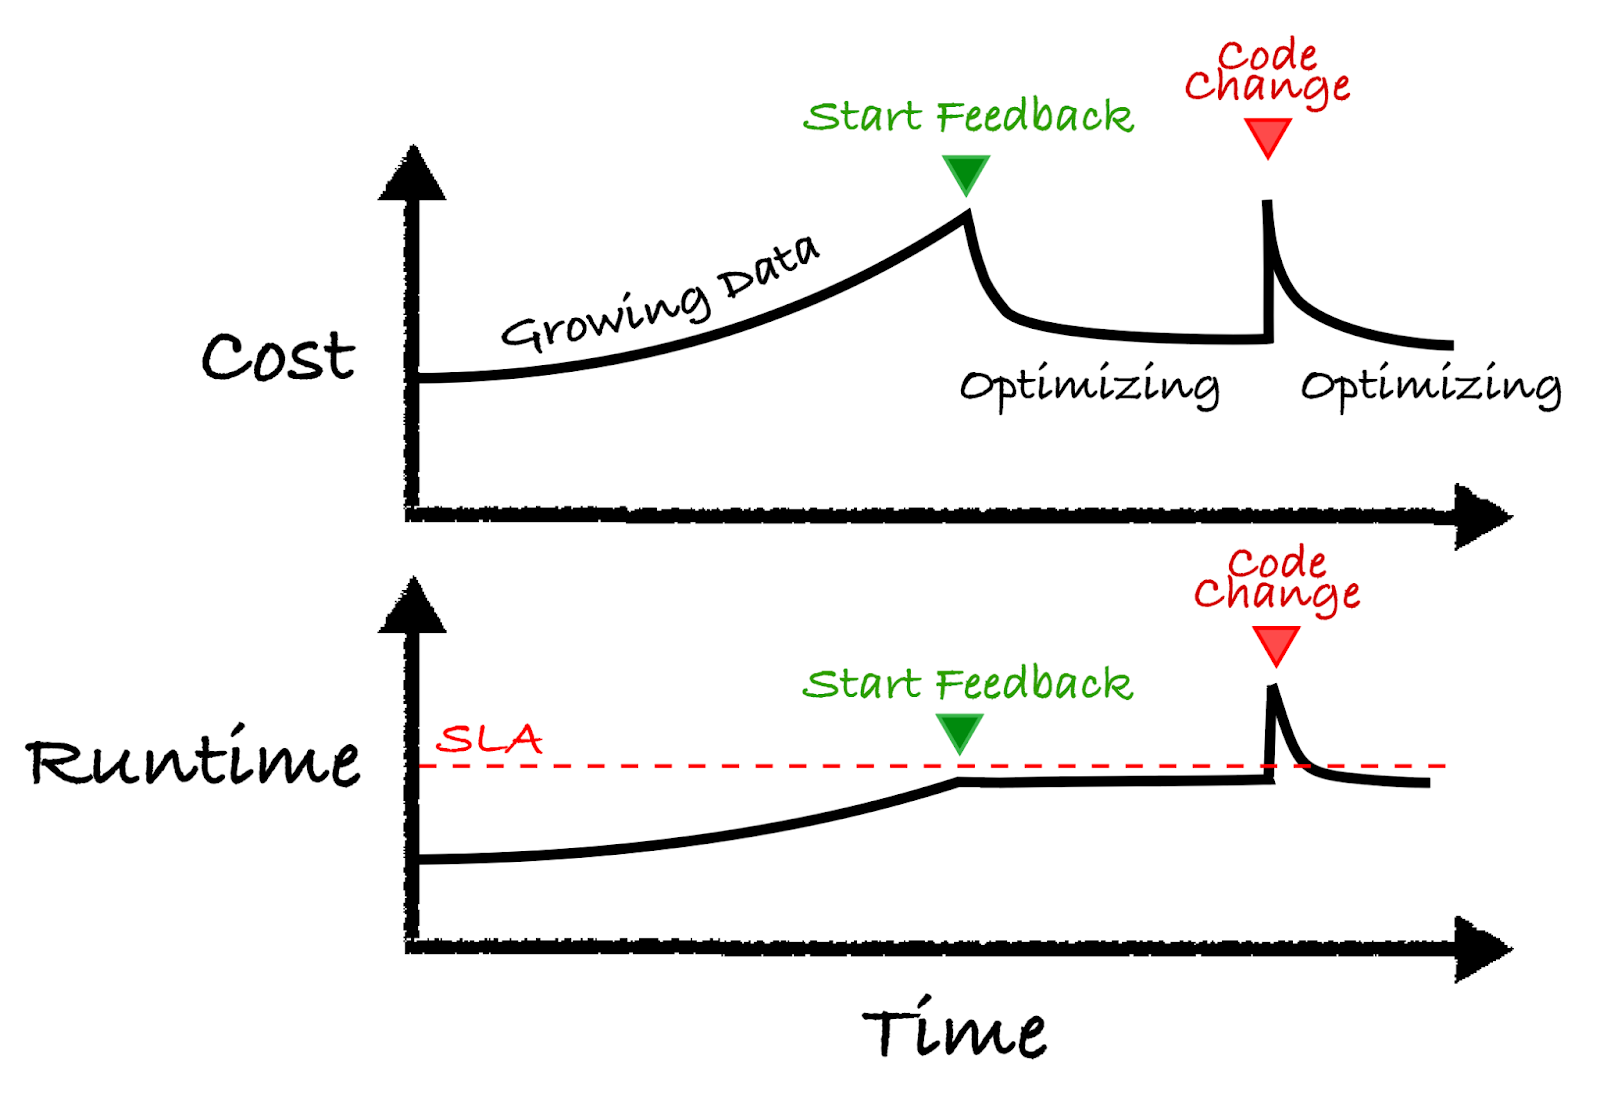
As most data platform people can confirm, things are always changing in their data pipelines. Two very popular scenarios are: data size growing over time, and code changes. Both of which can cause erratic behavior when it comes to cost and runtime.
The illustration below shows the basic concept. Let’s walk through the example from left to right:
Start: Let’s say you have a job and over time the data size grows. Normally your cluster stays the same and as a result both costs and runtime increases.
Start Feedback: Over time the runtime approaches the SLA requirement and the feedback control system kicks in at the green arrow. At this point, the control system changes the cluster to stay below the red line while minimizing costs.
Code Change: At some point a developer pushes a new update to the code which causes a spike in the cost and runtime. The feedback control system kicks in and adjusts the cluster to work better with the new code change.
Hopefully these two examples explain the potential benefit of how a closed loop control pipeline can be beneficial. Of course in reality there are many details that have been left out and some design principles companies will have to adhere to. One big one is a way for configurations to revert back to a previous state in case something goes wrong. An idempotent pipeline would also be ideal here in case many iterations are needed.
Conclusion
Data pipelines are complex systems, and like any other complex system, they need feedback and control to ensure a stable performance. Not only does this help solve technical or business problems, it will dramatically help free up data platform and engineering teams to focus on actually building pipelines.
Like we mentioned before, a lot of this hinges on the performance of the “update config” block. This is the critical piece of intelligence that is needed to the success of the feedback loop. It is not trivial to build this block and is the main technical barrier today. It can be an algorithm or a machine learning model, and utilize historical data. It is the main technical component we’ve been working on over the past several years.
In our next post we’ll show an actual implementation of this system applied to Databricks Jobs, so you can believe that what we’re talking about is real!
Interested in learning more about closed loop controls for your Databricks pipelines? Reach out to Jeff Chou and the rest of the Sync Team.