monitoring

March 2024 Release Notes

release notes

Our team has been hard at work to deliver industry-leading features to support users in achieving optimal performance within the Databricks ecosystem. Take a look at our most recent releases below.

Worker Instance Recommendations

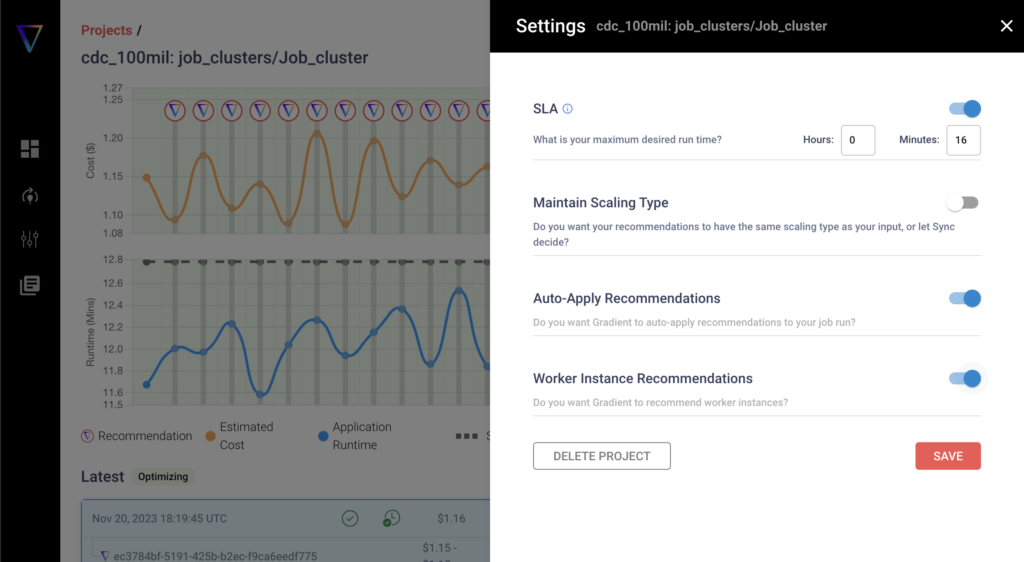
Introducing Worker Instance Recommendations directly from the Sync UI. With this feature, you are able to tap into optimal cluster configuration recos so that your configs are optimized for individual jobs.

The instance recos within Gradient not only optimize the number of workers, but also the worker size. For example, if you are using i3.2xl instances, Gradient will find the right instance size (such as i3.xl, i3.4xl, i3.8xl, etc) in the i3 instance type.


Instance Fleet Support

If your company is using Instance Fleet Clusters, Gradient is now compatible!  There are no changes required on the user flow, as this feature is automatically supported in the backend.  Just onboard your jobs like normal into Gradient, and we’ll handle the rest.

Hosted Log Collection


Running Gradient is now more streamlined than ever! You’re now able to opt into hosted log collection entirely in the Sync environment with Sync-hosted or user-hosted collection options. What does this mean? It means that there are no extra steps or external clusters needed to run Gradient, allowing Sync to do all the heavy lifting while minimizing the impact on your Databricks workspace. 

With hosted DBX log collection within Gradient, you’re able to minimize onboarding errors due to annoying permission settings while increasing visibility into any potential collection failures, ultimately giving you and your team more control over your cluster log data.


Getting Started with Collection Setup
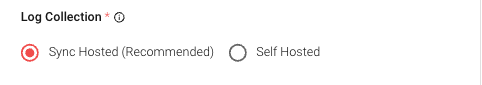
The Databricks Workspace integration flow is triggered when a user clicks on Add → Databricks Workspace after they have configured their workspace and webhook. Users will also now have a toggle option to choose between Sync-hosted (recommended) or User-hosted collection.

  • Sync-hosted collection – The user will be optionally prompted to share their preference for cluster logs stored for their Databricks Jobs. This will initially be an immutable setting saved on the Workspace.
    • For AWS – Users will need to add a generated IAM policy and IAM Role to their AWS account. The IAM policy allows us to ec2:DescribeInstances, ec2:DescribeVolumes, and optionally an s3:GetObject and s3:ListBucket to the specific bucket and prefix to which users have configured uploading cluster logs. S3 permissions are optional because they may be using DBFS to record cluster logs. The user needs to add a “Trusted Relationship” to the IAM role to give our Sync IAM role permissions to sts:AssumeRole using an ExternalId we provide them. Gradient will then generate this policy and trust relationship for the user in a JSON format to be copy and pasted.
    • For Azure – Coming soon!
  • User-hosted collection – For both Azure/AWS will proceed as the normal workspace integration requirements dictate

Stay up to date with the latest feature releases and updates at Sync by visiting our Product Updates documentation.

Ready to start getting the most out of your Databricks job clusters? Request a demo or reach out to us at info@synccomputing.com.

Sync Computing Partners with Databricks for Lakehouse Job Cluster and Usage Optimization

Self-improving machine learning algorithms provide job cluster optimization and insights for Databricks users

CAMBRIDGE, Mass. – Sync Computing, the industry-leading data infrastructure management platform built to leverage machine learning (ML) algorithms that allow users to automatically maximize data compute performance, today announced that it has joined forces with Databricks go-to-market (GTM) teams and their Technology Partner Program. The end goal is to help Databricks customers achieve lower costs, improved reliability, and automatic management of compute clusters at scale. With the collaboration of the two technology powerhouses efforts, Databricks customers will gain the opportunity to take advantage of Sync Computing’s Gradient solution for SLA optimization, real-time insights, and significant cost savings so that teams are able to focus on greater business objectives and ROI.

Platform and data engineering teams are constantly faced with changing pressures as the data infrastructure landscape becomes increasingly complex. They are met with ongoing needs to iterate quickly, gain real-time insights, and maximize performance all while managing cost. The Gradient platform by Sync Computing provides a single source of truth for cost tracking, data governance, and unified metrics monitoring.

The management and cost of data pipelines is top of mind for engineering teams especially in the current economic climate. However, tuning clusters to hit cost and runtime goals is a task nobody has time for,” said Jeffrey Chou, CEO and co-founder of Sync Computing. “Databricks customers who use Sync’s Gradient toolkit are now open to a whole new world of opportunities as they can offload these tasks to Gradient while they focus on more urgent business goals. Organizations absolutely love the ROI they see almost immediately.”

Sync Computing’s machine learning-powered optimization delivers recommendations for Databricks clusters, without making any changes at the code level. Using a closed-loop feedback system, Gradient automatically builds custom-tuned machine learning models for each Databricks job it is managing using historical run logs — continuously driving Databricks jobs cluster configurations to hit user-defined business goals.

Sync for Databricks allows companies to:

  • Enable platform teams full governance over config changes to meet business demands
  • Slash Databricks compute and operating costs by up to 50%
  • Gain coveted insights into DBU, cloud costs, and cluster anomalies
  • Hit SLAs even as data pipelines change

Sync integrates with leading cloud platforms like Amazon Web Services (AWS) and Microsoft Azure to programmatically optimize for tools like Apache Airflow and Databricks workflows, without changing a single line of code.

Learn how Sync helps organizations large and small optimize Databricks clusters at scale here.

About Sync Computing
Having been recognized as a Gartner Cool New Vendor, Sync Computing was originally spun out of MIT with the goal to make data and AI cloud infrastructure easier to control. With Sync’s one-of-a-kind solution, Gradient, users are given full ability to enable self-improving job clusters to hit SLA goals, gain infrastructure insights, and leverage tailored recommendations to achieve optimal performance. Recognized names such as Insider, Handelsblatt, Abnormal Security, Duolingo, and Adobe have relied on Sync to get the most out of the data-driven landscape with automated data optimization. To learn more, visit https://www.synccomputing.com.

Contact
McKinley Culbert
Marketing at Sync Computing
mckinley.culbert@synccomputing.com

What’s the difference between Databricks’s Overwatch and System Tables tools?

Databricks recently released System Tables, to help users understand and monitor their usage.  They also had the older and more skunk works project called Overwatch, which also provides usage and infrastructure information.  So what’s the difference between the two?  When should I use either one?  Let’s dive in!

Introduction

Databricks as a whole is a complex ecosystem from both technical compute intricacies to confusing pricing structures.  As a user, you likely have questions such as: What are my spark jobs doing? How high is my utilization and is it efficient? Who are the other users on my account and what are their compute costs? Which tables are they accessing?

Databricks currently has two tools that people can use to help answer these questions and monitor metrics.  The first, and older one, is called Overwatch, and the other is the more recently released product System Tables.  There are some pros and cons of both platforms, and we’ll walk through the points we found relevant below:

High level overview


Overwatch:  Was developed internally within the Databricks Labs, and was released several years ago.  It’s an open source side project, vs. a polished product out of Databricks.  

  • Pros: Overwatch provides many metrics, from low level Spark event metrics to cost data – we recommend viewing their docs to see more details as to what metrics it surfaces.  Since it’s open source, it’s incredibly customizable and can work in real-time.
  • Cons:  It’s very complicated to set up, especially the real-time monitoring service.  This is not an easy tool to use, and likely only for advanced Databricks users. While it contains a lot of data, it is difficult to extract actionable insights from the data without Spark expertise.  Users also accrue compute costs to host Overwatch (admittedly it seems like a small overhead cost relative to your total Databricks costs).

System TablesAn official product out of Databricks launched in 2023, and has a focus on high level usage, costs, and access.

  • Pros:  It’s fully integrated with their Unity catalog, and users can get up and running pretty quickly within the Databricks platform.  It is more geared for analyzing usage and cost information.
  • Cons:  It is less focused on low level Spark metrics, which means it will be less useful if you’re looking for a tool to help you optimize your code.  One other big note is System tables is not a real-time service, data is only updated several times a day (as of the date of this blog).  One other note, System tables doesn’t seem to feed in your cloud costs, and only reports on DBU costs – this is a bit disappointing since cloud costs can often be greater than your DBU costs.

What information is monitored?

  • Overwatch – The full and official list of the parameters monitored can be found on their docs page.  The broad categories are Databricks workflows, compute, Spark UI, Databricks SQL, and security. For a more opinionated view of what information they provide, I recommend checking out their pre-built dashboards page which describes popular metrics to track.  I also recommend seeing their scopes and modules page to see the granular Spark metrics that are reported.  Since there are more similarities than differences between the two systems, let’s identify what’s unique in Overwatch and not in System Tables:
    • Failed Jobs
    • Spark Eventlogs
    • Cloud costs (need to set up manually)
    • Cluster metrics (need to set up manually)
    • Real-time cost estimates 
  • System Tables – The list of information provided by System Tables can be found on their main page.  At the highest level there are several tables provided today: audit logs, billable usage logs, pricing table, table and column lineage, and marketplace listing access.  Some of the unique pieces of information that System tables have is:
    • Data lineage
    • System Access
    • Marketplace pricing

What is the setup process like?

  • Overwatch – The main instructions for installing Overwatch can be found on the deploy page.  To say the least, it’s complicated.  It requires you to configure your cloud, security, secrets, audit logs, and a host of other options.  One thing we also found was if you did want to pipe in your actual cloud costs, the user has to do a lot of pipeline building to feed your cloud cost information to Overwatch.  If a user wants to collect real-time cluster metrics, the user will have to write a script to collect the metrics and set up a time-series database.
  • System Tables – Enabling system tables is pretty easy, you do need to have at least one unity-catalog enabled workspace.  System tables must be enabled by an account admin. You can enable system tables using the Unity Catalog REST API.  Once enabled, the tables will appear in a catalog called system, which is included in every Unity Catalog metastore. In the system catalog you’ll see schemas such as access and billing that contain the system tables.

What are some use cases?

  • Common Use Cases
    • Monitoring Databricks costs –  Break down your costs by user, tags, notebook, job, etc.  
    • Finding the “expensive” jobs – Locate cost hotspots and identify who is responsible.
  • Overwatch 
    • Low level Spark metrics to optimize code – An expert user can inspect the detailed Spark job information that overwatch surfaces (i.e. task, stage, executor metrics, etc.) to design an optimization plan specific to their jobs. 
    • Real-time cluster information for monitoring – Users can check the utilization of their clusters and make case-by-case decisions on cluster and instance sizing, for example. 
  • System Tables
    • Monitoring who is accessing which table
    • Monitoring usage with specific tags
    • Viewing the lineage of my tables

What do neither of them do?

  • No actionable decisions  – Both of these systems surface excellent and useful information for companies to review.  However, there is always the question of “what do I do with this data?”  That is still left for the user to decide what to do – as there are plenty of great options.  So if users are looking for a solution that goes beyond monitoring and dashboards, they’ll need to look elsewhere.
  • No job optimizations – Neither platform actually optimizes your jobs, they simply report metrics.  They can help flag problematic jobs, but then a human engineer is still required to go in and optimize things.  Whether or not companies have bandwidth to send an engineer to go chasing random problems here and there is another question.  While these platforms are great for identifying large hotspots, they aren’t great at optimizing a large number of jobs simultaneously.

Conclusion

Here at Sync, we are huge fans of both platforms.  My opinion is the System Tables will eventually take over as the “real” product for monitoring Databricks usage, as it’s probably fairly trivial to add in the Spark metrics to system tables.  So if I were a company aiming to invest in one or the other, i’d go with System tables.  They are also massively easier to set up to get up and running.  

However, the drawback of both platforms are both real – basically neither of them do any active optimization.  That’s why we built Gradient, a closed-loop feedback system that continuously optimizes your Databricks jobs to hit your business goals.  We built the missing intelligence that mines much of the same data as Overwatch, and provides automatic recommendations that data engineers can instantly apply.

Interested in learning more about Gradient to optimize your Databricks jobs? Reach out to Jeff Chou and the rest of the Sync Team.