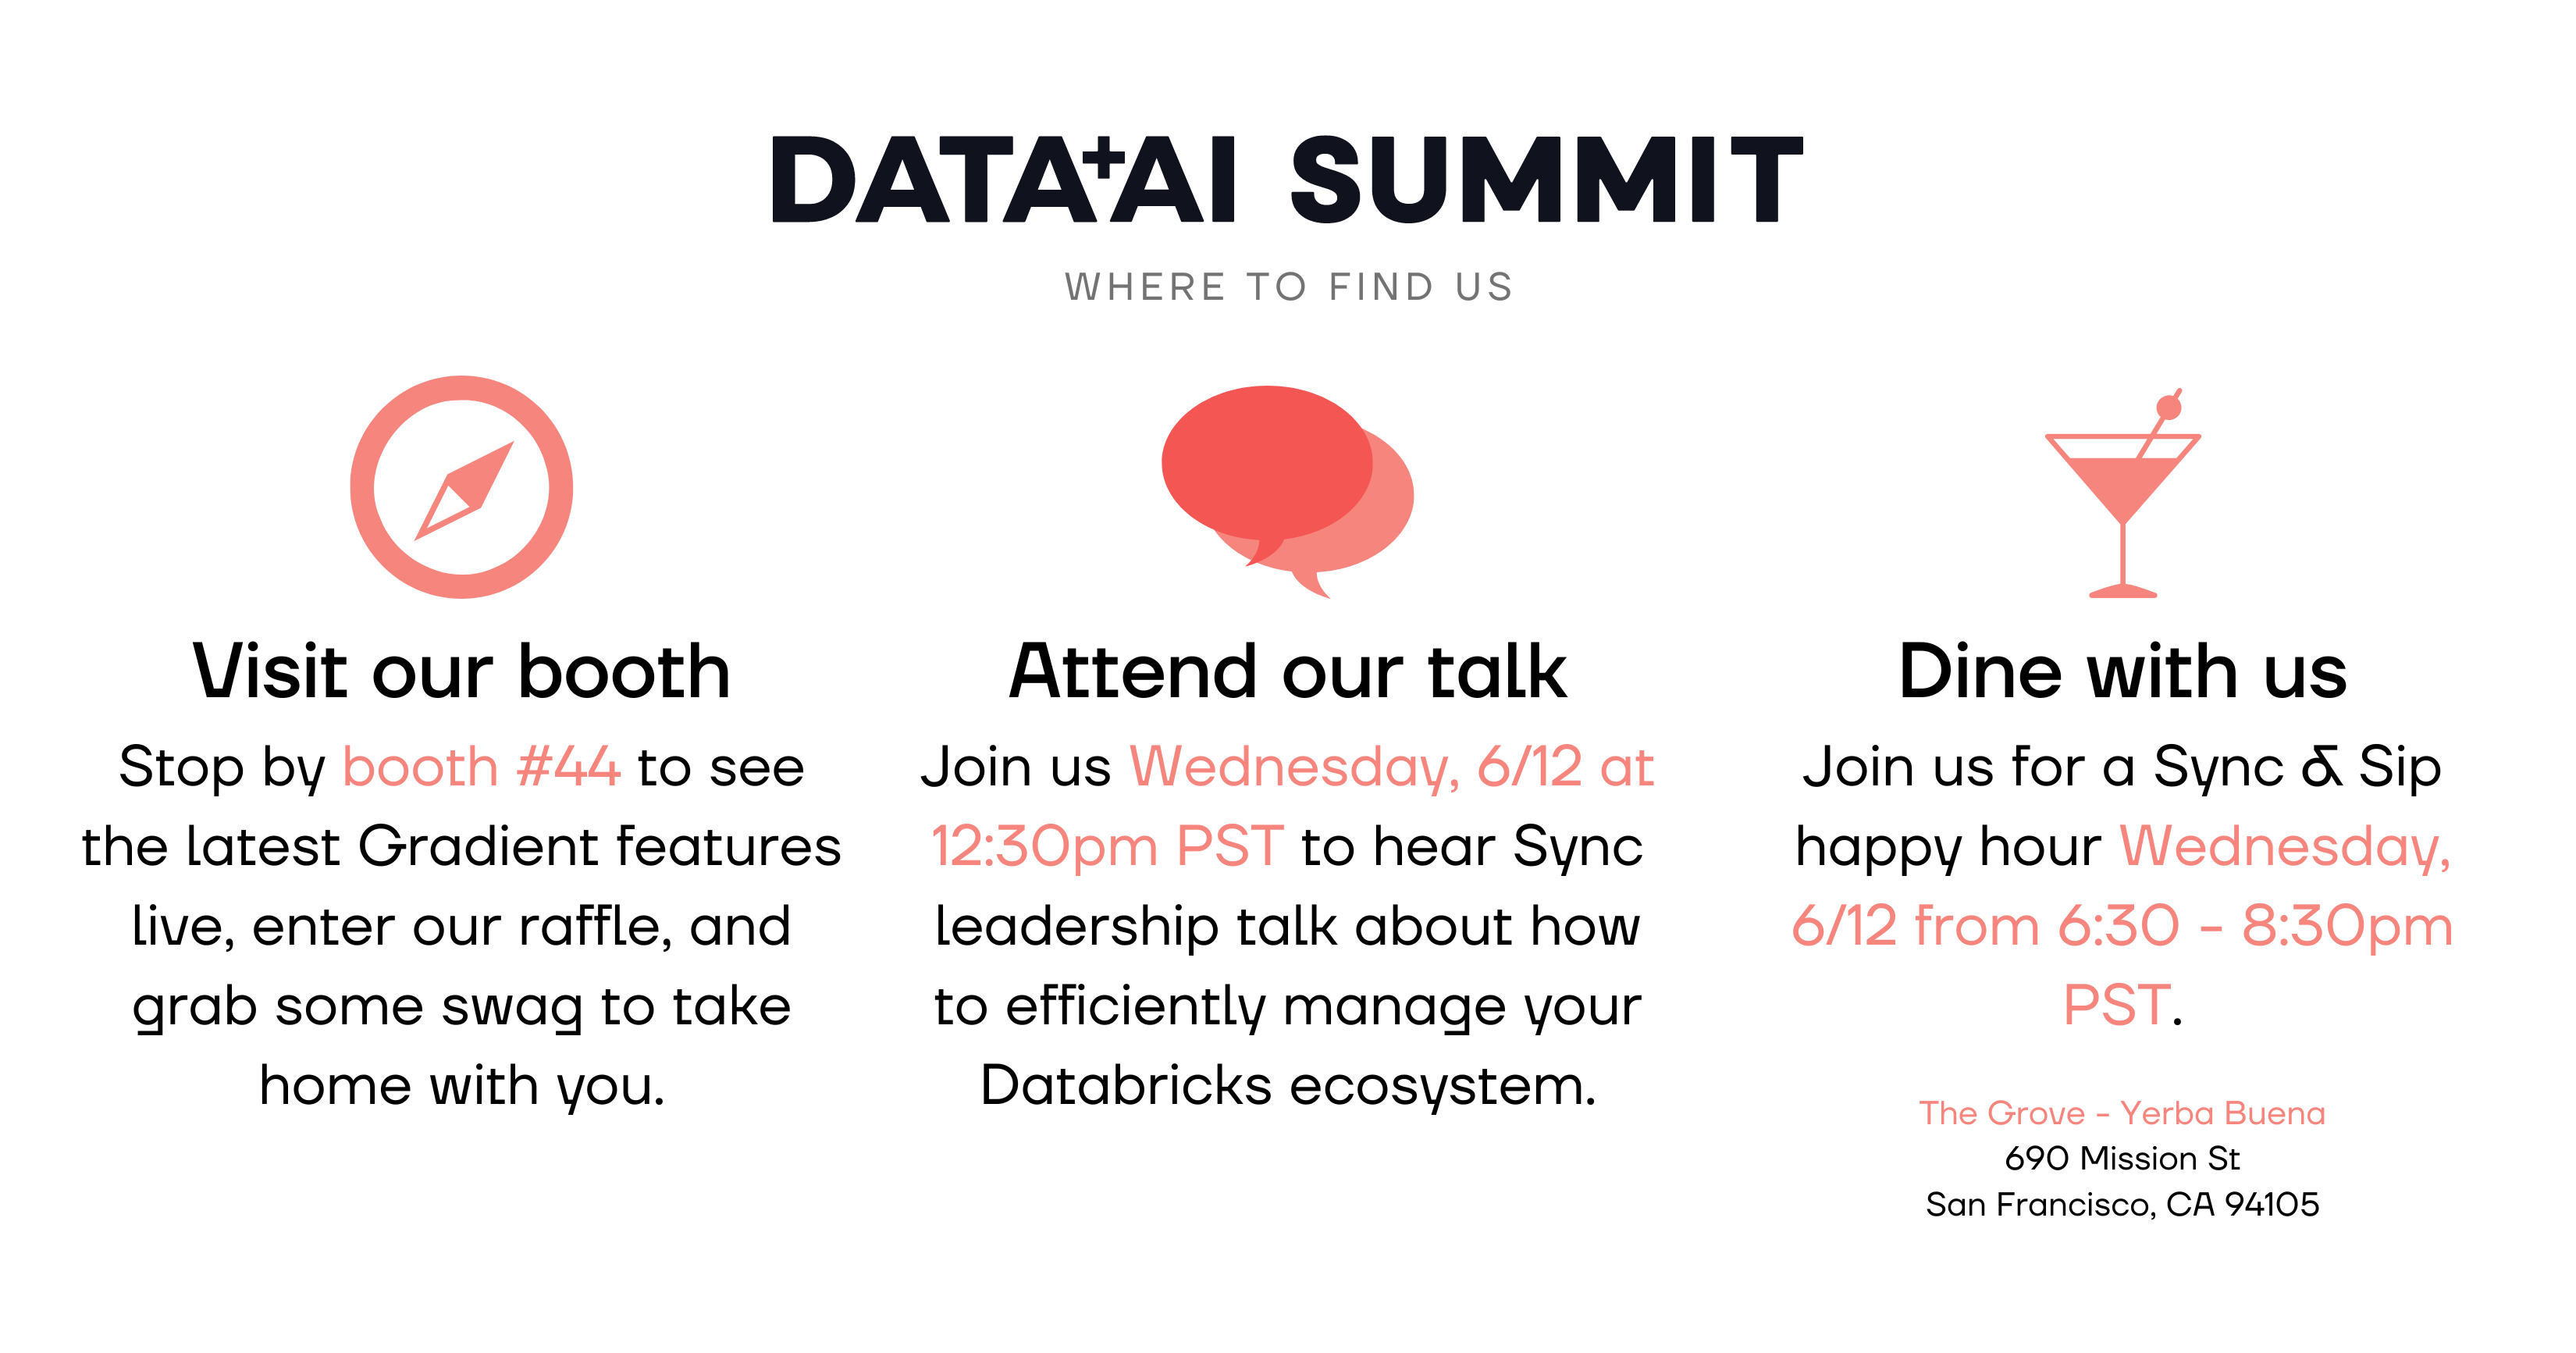
With the Databricks Data+AI Summit 2024 just around the corner, we of course had to have a major product launch to go with it!
We’re super excited to announce an entirely new user flow and features to the product, making it faster to get started and providing a more comprehensive management solution. At a high level, the new expansion involves these new features:
- Discover – Find new jobs to optimize
- Monitor – Track all job costs and metrics over time
- Automate – Auto-apply to save time, costs, and hit SLAs
With ballooning Databricks costs and constrained budgets, Databricks efficiency is crucial for sustainable growth for any company. However, optimizing Databricks clusters is a difficult and time consuming task riddled with low level complexity and red tape.
Our goal with Gradient is to make it as easy and painless as possible to identify jobs to optimize, track overall ROI, and automate the optimization process.
The last automation piece is what sets Gradient apart. Gradient is designed to optimize at scale, for companies that have 100+ production jobs. At that scale, automation is a must, and is where we shine. Gradient provides a new level of efficiency unobtainable with any other tool on this planet.
With automatic cluster management, engineering teams are free to pursue more important business goals while Gradient works around the clock.
Let’s drill in a bit deeper into what these new features are:
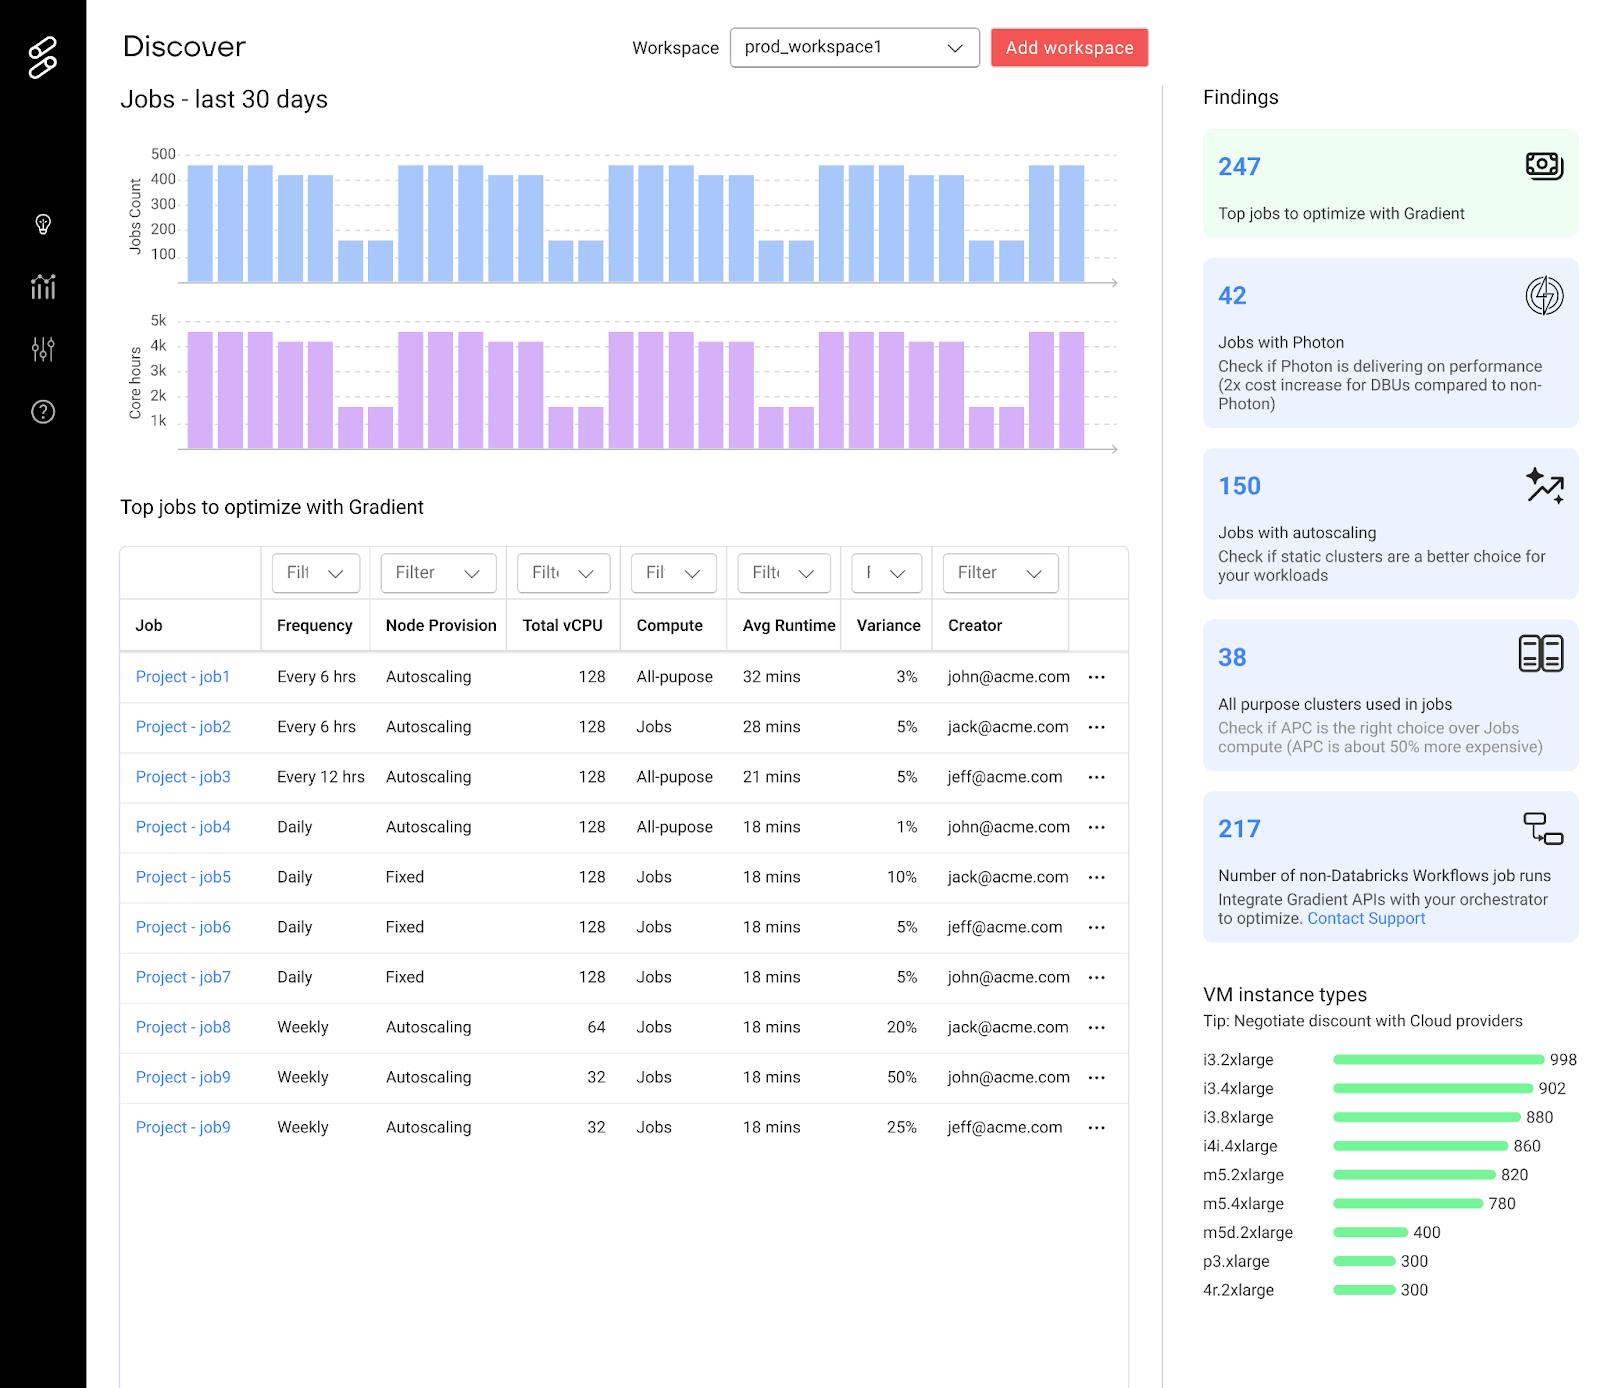
Discover
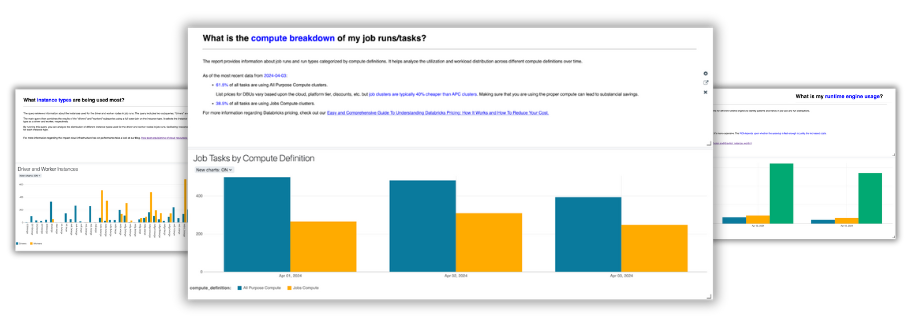
Find your top jobs to optimize as well as discover new opportunities to improve your efficiency even more. This page is refreshed daily so you always get up-to date insights and historical tracking.
How to get started – Simply enter your Databricks credentials and click go! You can get running from scratch in less than a minute
What is shown:
- Top jobs to optimize with Gradient
- Jobs with Photon enabled
- Jobs with Autoscaling enabled
- All purpose compute jobs
- Jobs with no-job id (meaning they could come from an external orchestrator like Airflow)
To see how fast and easy it is to get the Discover page up and running, check out the video below:
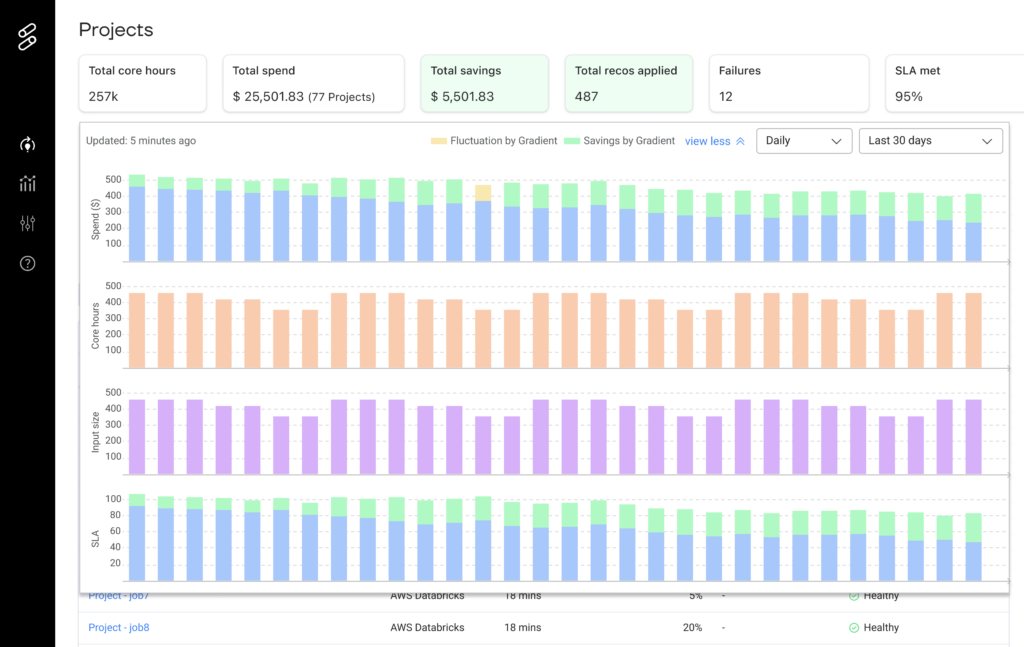
Monitor
Track Spark metrics and costs of all of your jobs managed with Gradient in a single pane of glass view. Use this view to get a bird’s eye view on all of your jobs and track the overall ROI of Gradient with the “Total Savings” view.
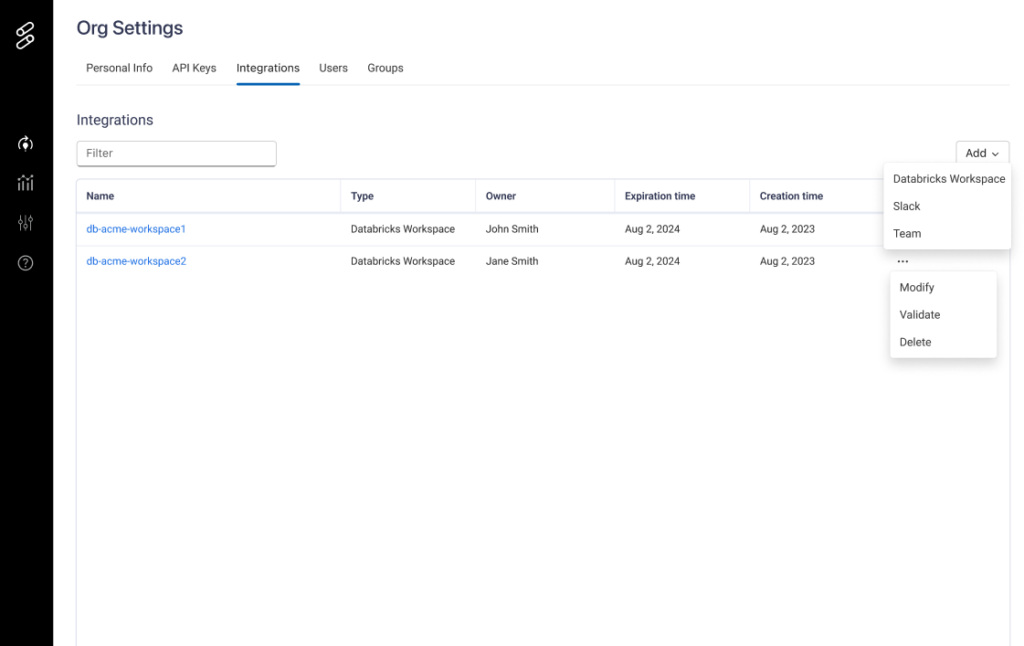
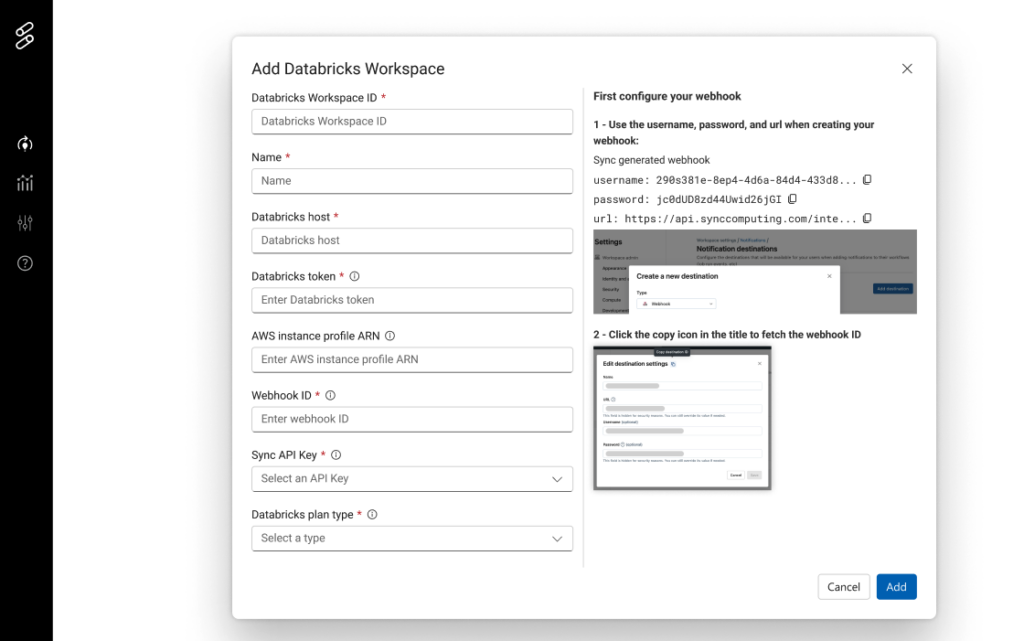
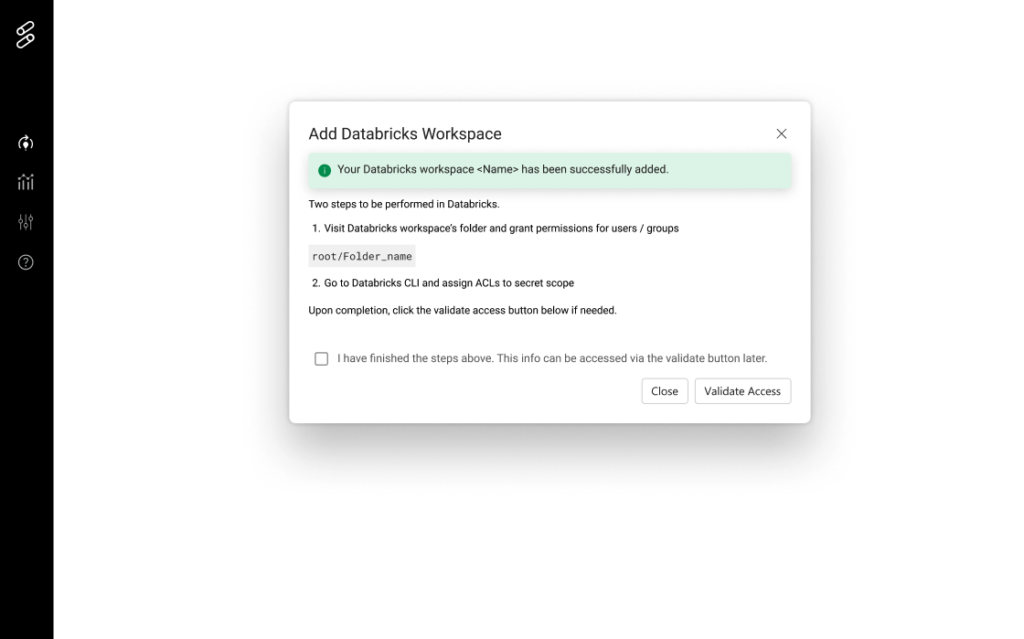
How to get started – Onboard your Databricks workspace in the integration page. This may require involving your devops teams as various cloud permissions are required.
What is shown:
- Total core hours
- Total Spend
- Total recommendations applied
- Total cost savings
- Total estimated developer time saved
- Total number of projects
- Number of SLAs met
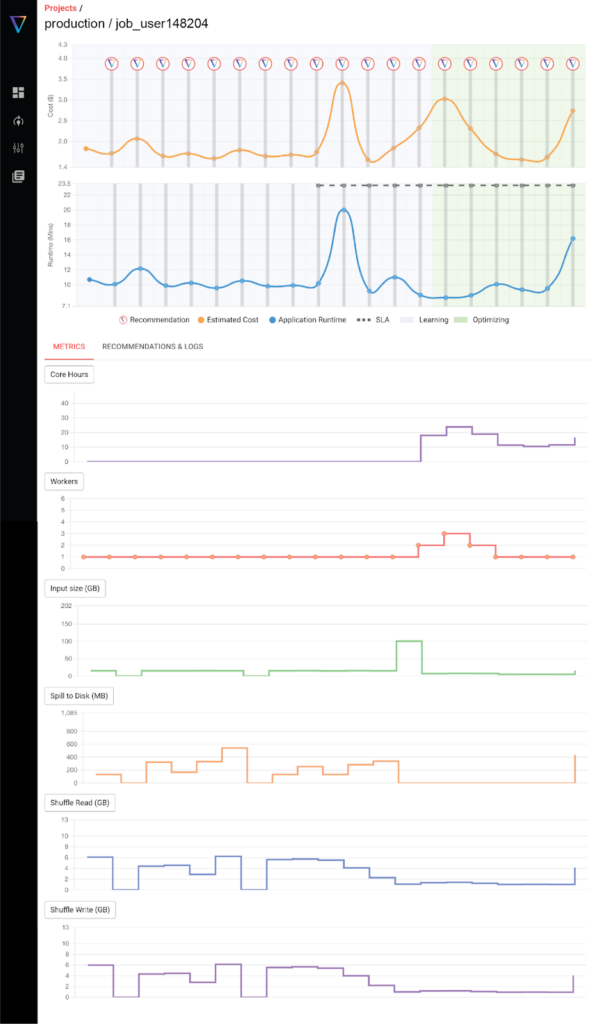
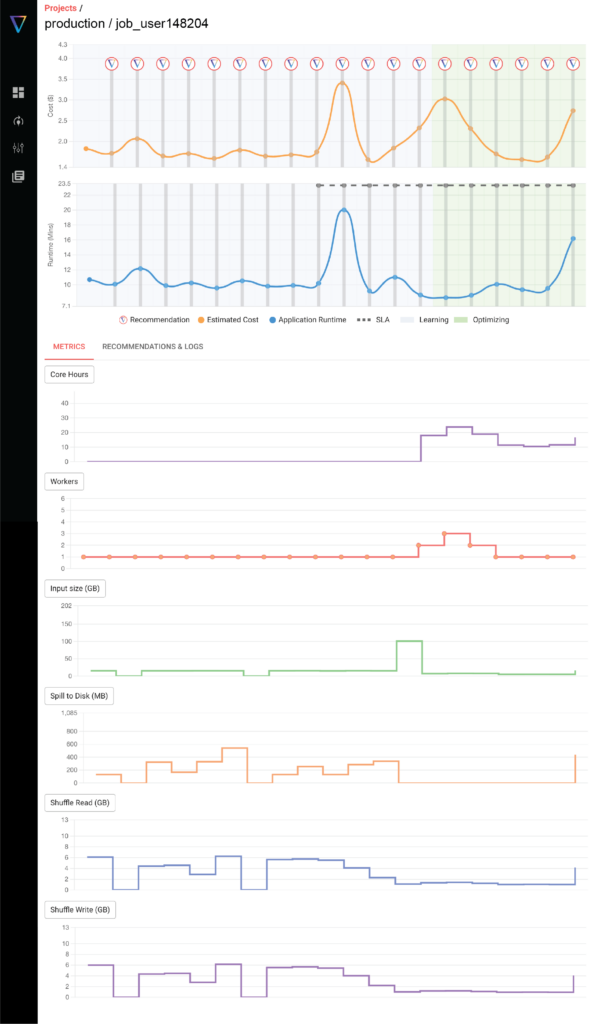
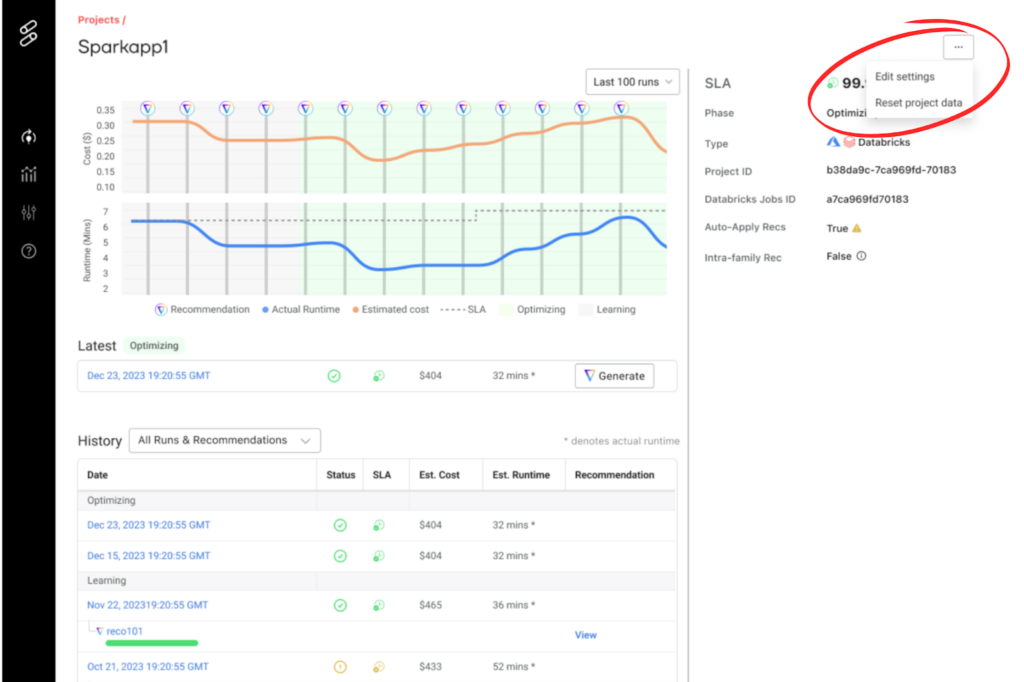
Automate
Enable auto-apply to automatically optimize your Databricks jobs clusters to hit your cost and runtime goals. Save time and money with automation.
How to get started – Onboard your Databricks workspace in the integration page (no need to repeat if already done above)
What is shown:
- Job costs over time
- Job runtime over time
- Job configuration parameters
- Cluster configurations
- Spark metrics
- Input data size

Conclusion
Get started in a minute yourself with the Discover page and start finding new opportunities to optimize your Databricks environment. Login yourself to get started!
Or if you’d prefer a hands on demo, we’d be happy to chat. Schedule a demo here