The problem today
In the world of cloud computing today, there remains an echo of the past that comes from the old server days that still haunts us today – manual compute resource selection.
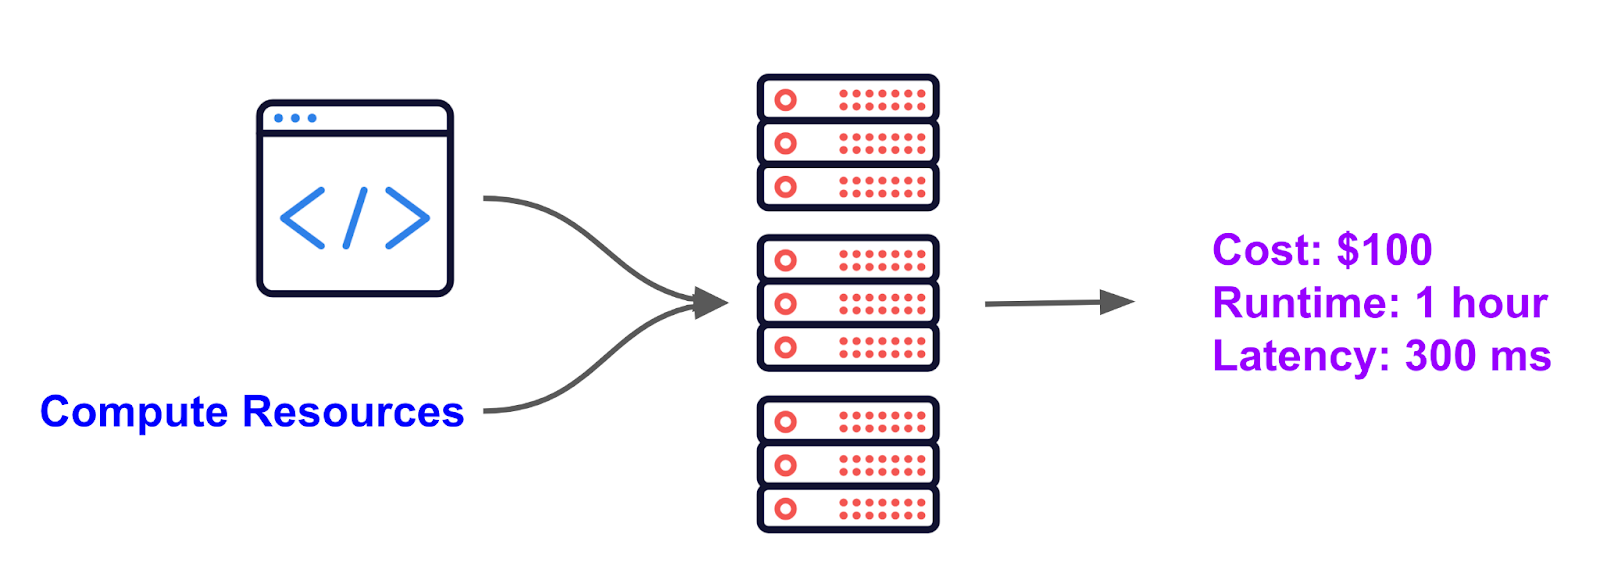
At a very high level, there are are always 2 pieces of information you need to provide to a compute cluster before your job can run:
- Your code / data
- Compute resources (e.g. warehouse size, instance types, memory, number of workers)
Some examples of popular platforms with recurring jobs and their basic infrastructure choices are shown in the table below. In reality, many of these systems have substantially more options and configurations, but our goal was to highlight the fundamental computing specific knobs.
Example cloud platforms and their tuning knobs (links provided)
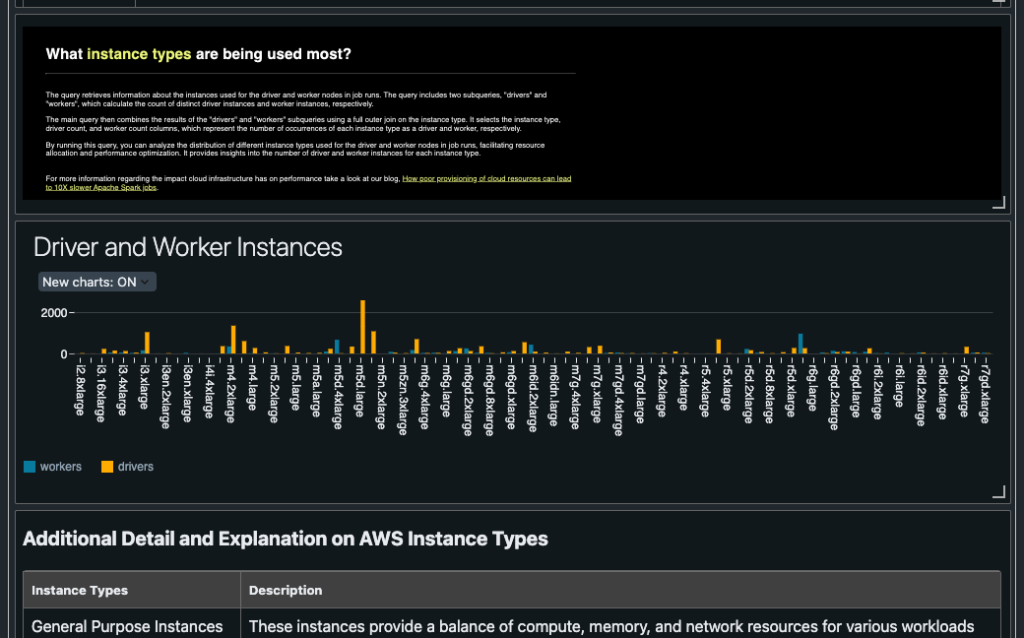
- Databricks Jobs/Delta Live Tables — Instance type, Instance size, number of workers
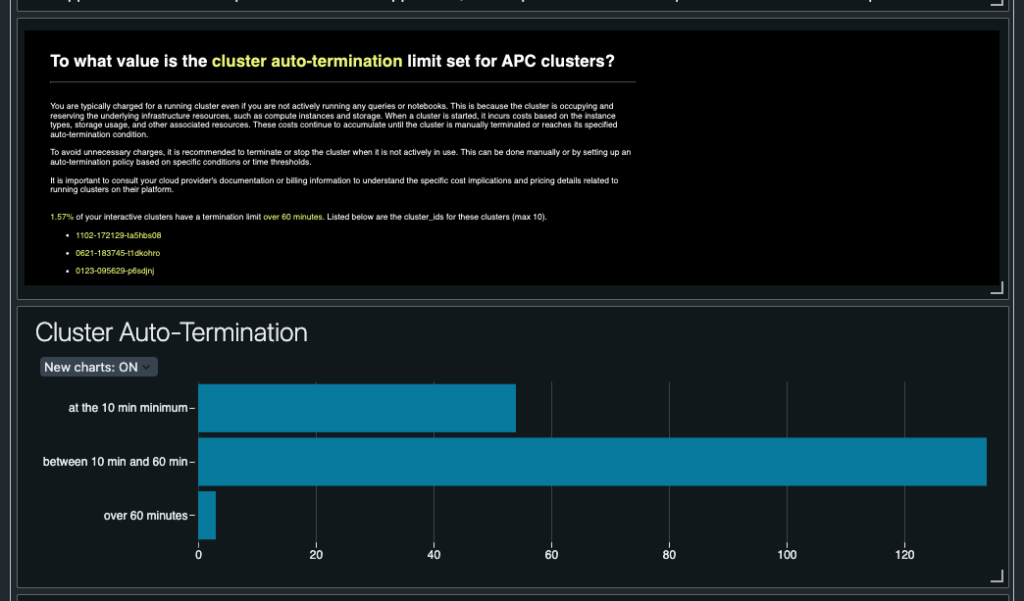
- SQL Warehouses (e.g. Databricks, Snowflake) — Warehouse size, Auto-suspend time
- EMR on AWS — Instance type, instance size, number of workers
- General Cron jobs on EC2 — Instance type, instance size
- Fargate on AWS — CPU, memory
- Glue on AWS — Worker type, Number of Workers
- Lambda functions on AWS — Power (MB)
- GPUs for ML / Batch — Number of nodes, instance type, batch size, precision, learning rate
And the parameters that actually matter to any company, such as the cost, runtime, latency, accuracy — are always outputs of the current system. The figure below shows the general high level relationship.
While this is pretty much the gold standard of how computing is operated today, it has resulted to a few popular pain points in regards to the cloud:
- Costs are too high – Over Provisioning resources and forgetting about them leads to exorbitant waste for companies, even perhaps questioning the ROI of the cloud.
- Unable to manually tune at scale – If an engineer wanted to change the performance of their workload, it would require some manual tuning to change resources. This does not scale and is impossible when managing thousands of workloads.
- Performance goals can be missed – Data sizes can grow, code can change, the computing infrastructure is rarely constant. This can lead to fluctuating runtimes which may disrupt performance goals such as runtime, accuracy, or latency for example.
Declarative Computing – Outputs as Inputs
What if we flipped the story around? What if we submitted the goals of the cluster we want vs. the resources?
If we did, it would look something like this:
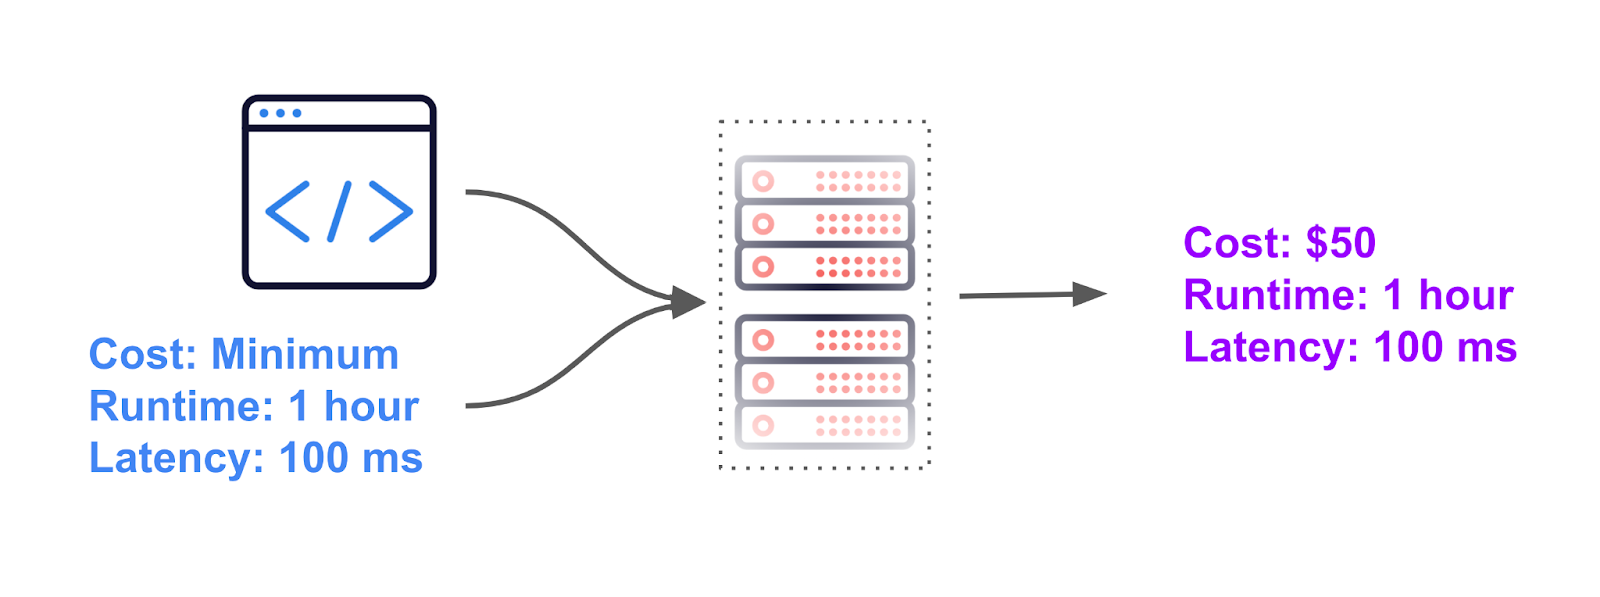
Where a user would input the high level performance goals, and then somehow a magical system would figure out the perfect hardware requirements to meet those goals.
In the above example, the goal was to minimize costs, while hitting a runtime of 1 hour and a latency of 100ms. The actual performance of the job was $50, with a runtime of 1 hour and a latency of 100 ms.
Much like the more well known concept of “declarative programming”, the goal of declarative computing is to describe what you want your compute infrastructure to do, not how – and to rely on some sort of “compiler” to figure out how.
Introducing declarative computing — a method to provision cloud computing infrastructure based on only the desired performance outcomes, such as cost, runtime, latency, accuracy etc…
So why doesn’t this exist already?
The reason why declarative computing doesn’t exist today is simply because it is extremely difficult to predict the output performance of your workloads simply based on your code and data.
To do so with no prior data and generally across millions of workloads I would say is actually impossible (except for perhaps very constrained situations).
Furthermore, cloud computing infrastructure is a moving object, with updates being pushed daily to various parts of the stack. The ability to accurately predict performance in a changing landscape is an incredibly hard problem to solve.
So how do we make this a reality?
The concept of declarative programming is quite straight forward, so how would it work?
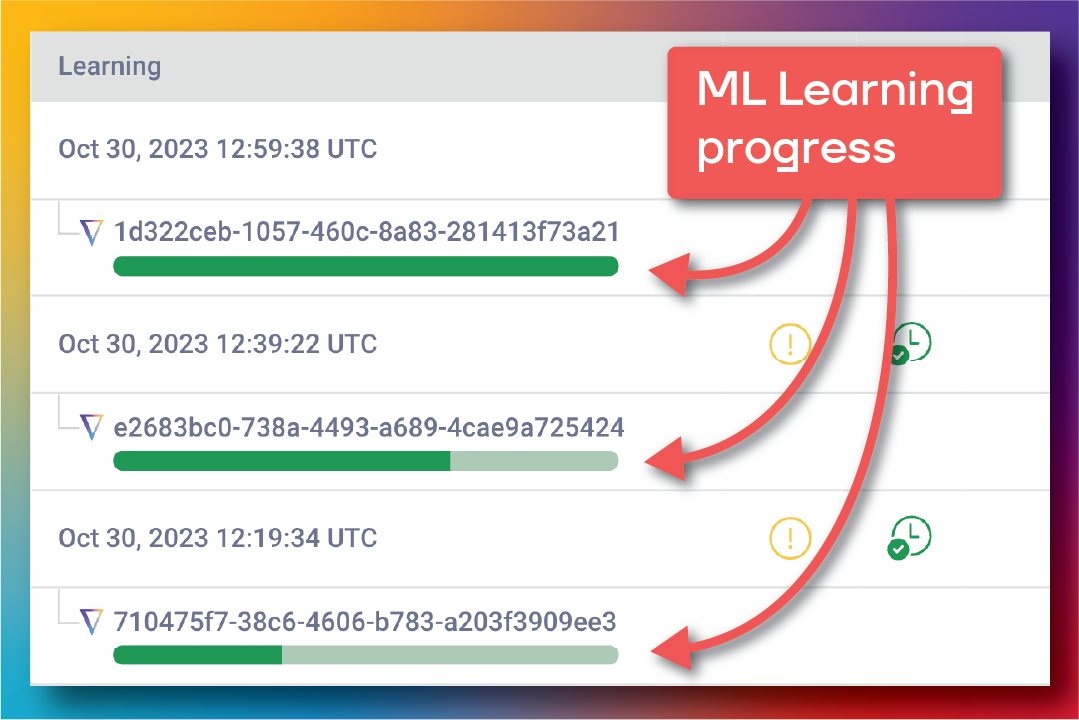
At a high level, what is missing in today’s ecosystem is a closed feedback loop, where the output performance of the job is used to train a machine learning model that can improve the infrastructure through iterative predictions.
The cartoon image below shows the basic idea, where a production workload gets cheaper, towards a target cost over time.
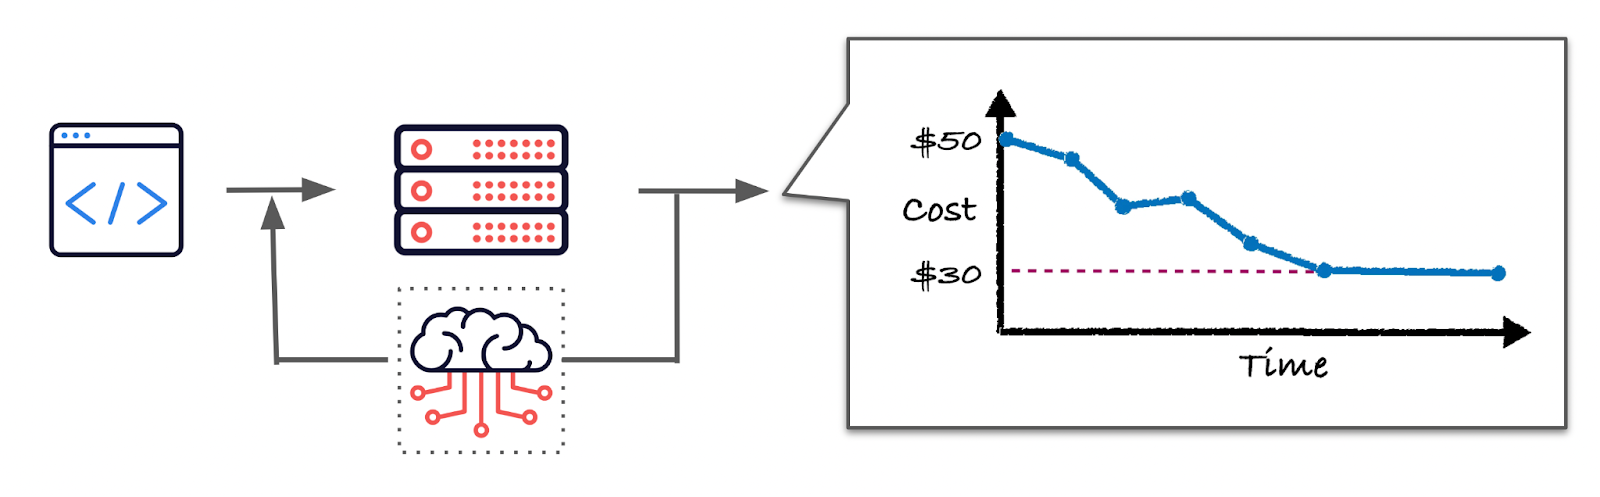
Although costs are shown here, you can swap out the target for any other quantitative metric, such as runtime, latency, accuracy, you name it, you got it.
The big roadblock here is, what is that machine learning algorithm to make this a reality?
How is this different from autoscaling?
Most autoscaling algorithms are governed by rules and policies as they react to some utilization metric. For example, add more nodes if utilization crosses 80%, remove nodes if utilization falls below 20%.
While this does a good job of ensuring that utilization is high, it doesn’t actually solve the problem of driving your infrastructure to hit a certain performance goal. It simply keeps utilization high, but how does utilization connect to cost or runtime goals?
This disconnect between infrastructure and business goals is the inherent difference between autoscaling and what “declarative computing” aims to do. Declarative computing aims to optimize towards actual business metrics, not some intermediate compute metric.
Doesn’t serverless do this already?
Serverless is more an abstraction layer, where the serverless provider is just making choices for you without your goals in mind. However, one big business difference is that the service provider is trying to maximize their profits while keeping the cost to users the same.
For example, let’s say you run a job on a “serverless” product, and it costs you $100. Behind the scenes it costs the service provider $70 to run the job. Perhaps 6 months later, some hot new employee at the cloud provider comes up with a better way to run the job and drops the cost to $30.
In this scenario, the cost to the user stays at $100, while the costs dropped for the service provider to $30. Their margins increased significantly, and your costs stayed the same. Basically, the service provider gets to reep all the benefits of optimization, and may not pass on the savings to you.
Serverless helps solve the problem of “it’s annoying to provision infrastructure” but doesn’t address the problem of pushing your infrastructure to achieve certain performance goals.
On a technical note – one key aspect to making declarative computing a reality, is tracking the same job over time – which is not a trivial task. What counts as the same job? What if many different data sources are going to the same job, is each data source a different “job”?
This type of tracking requires another level of coordination between the user and the compute stack to enable – which is not present in serverless solutions today.
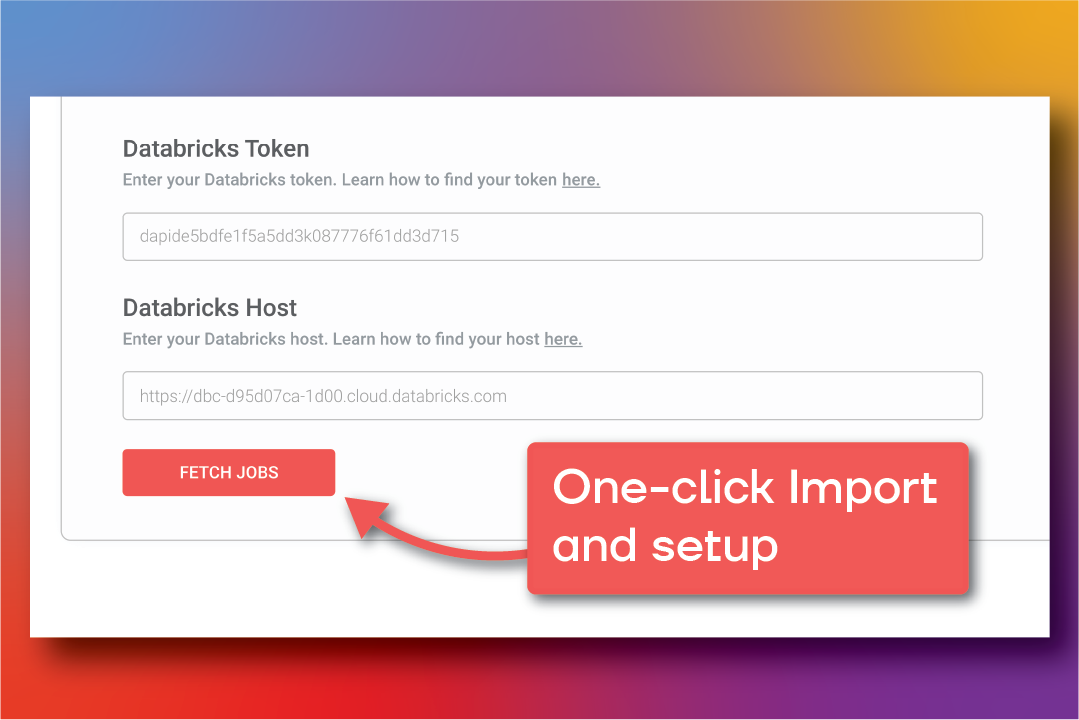
Declarative Computing for Databricks
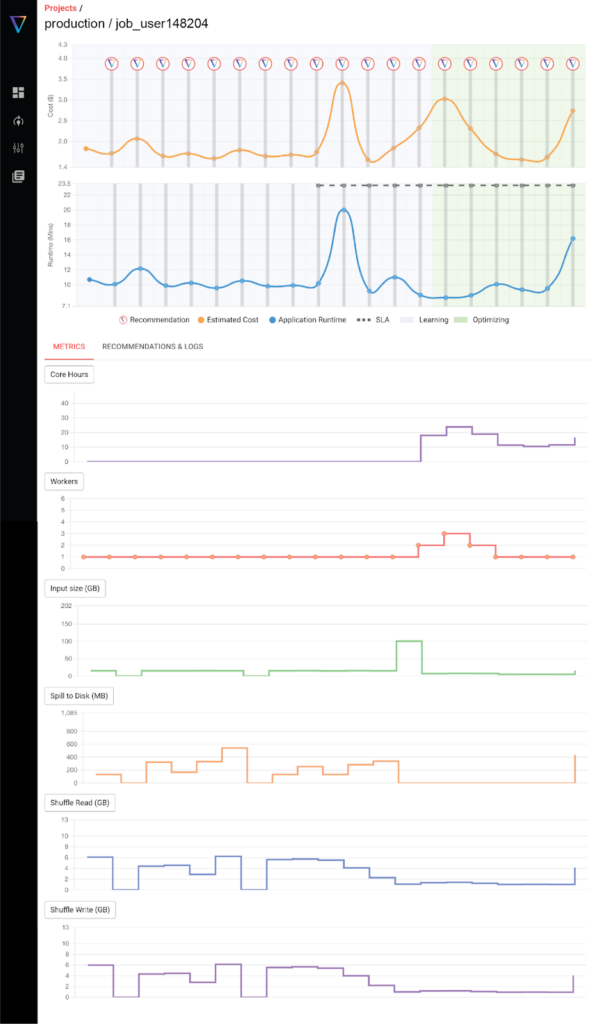
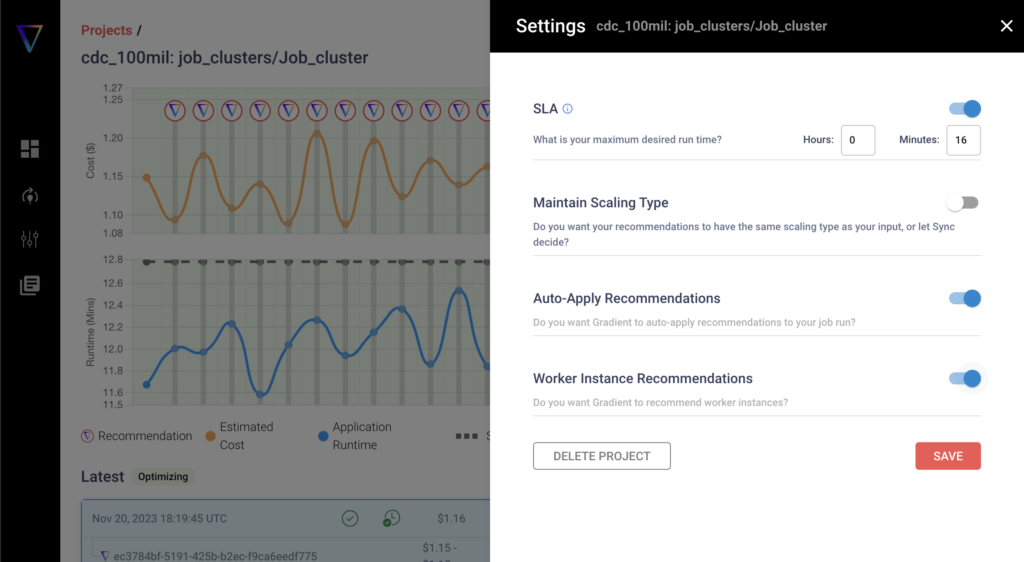
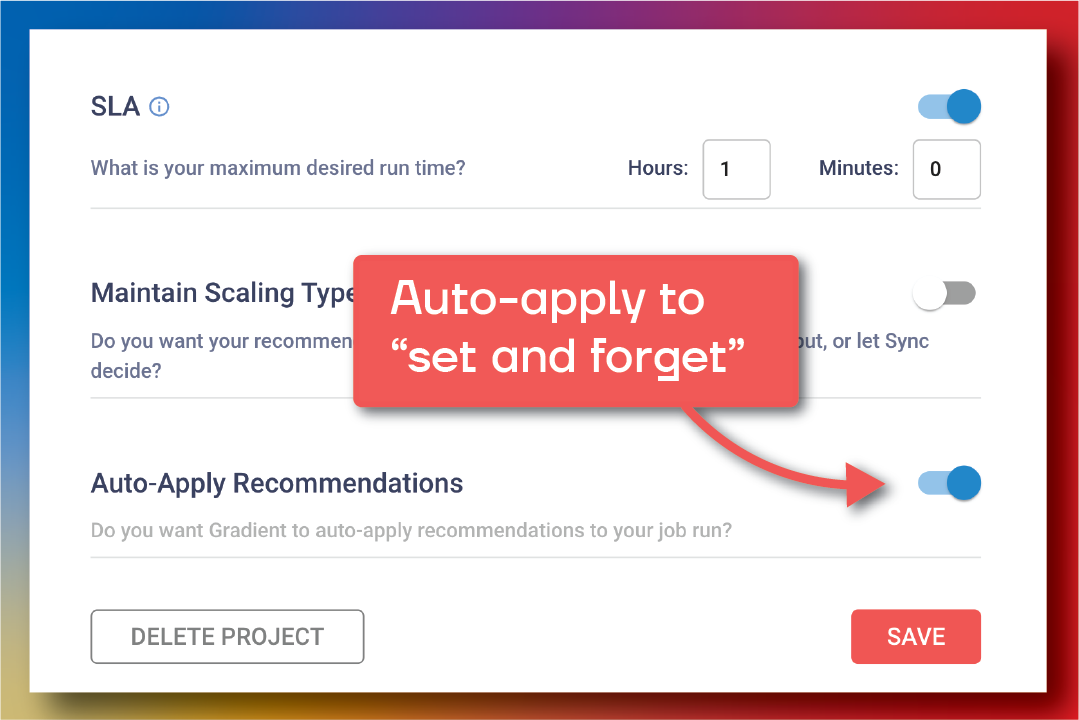
The concept of declarative computing isn’t just science fiction anymore. At the core, it’s what we’re building with our product Gradient. Today, Gradient focuses on Databricks clusters, to help users input their cost and runtime goals, while we help figure the right cluster to make it real.
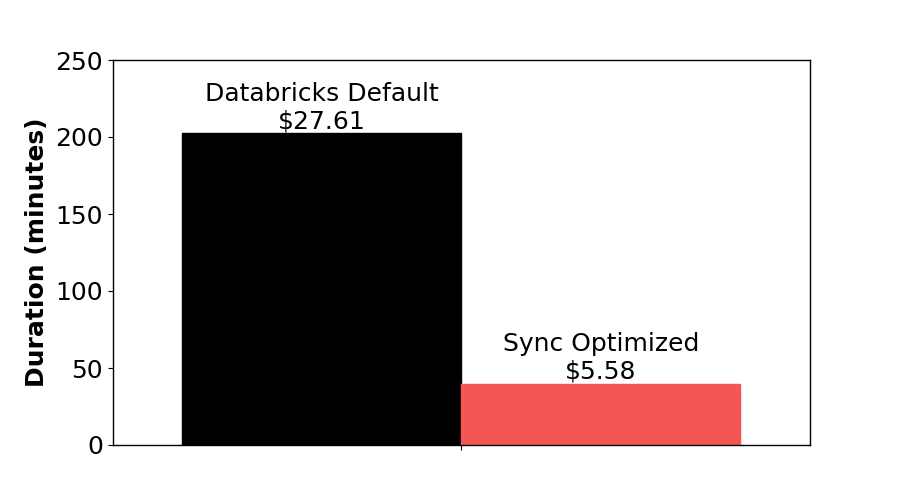
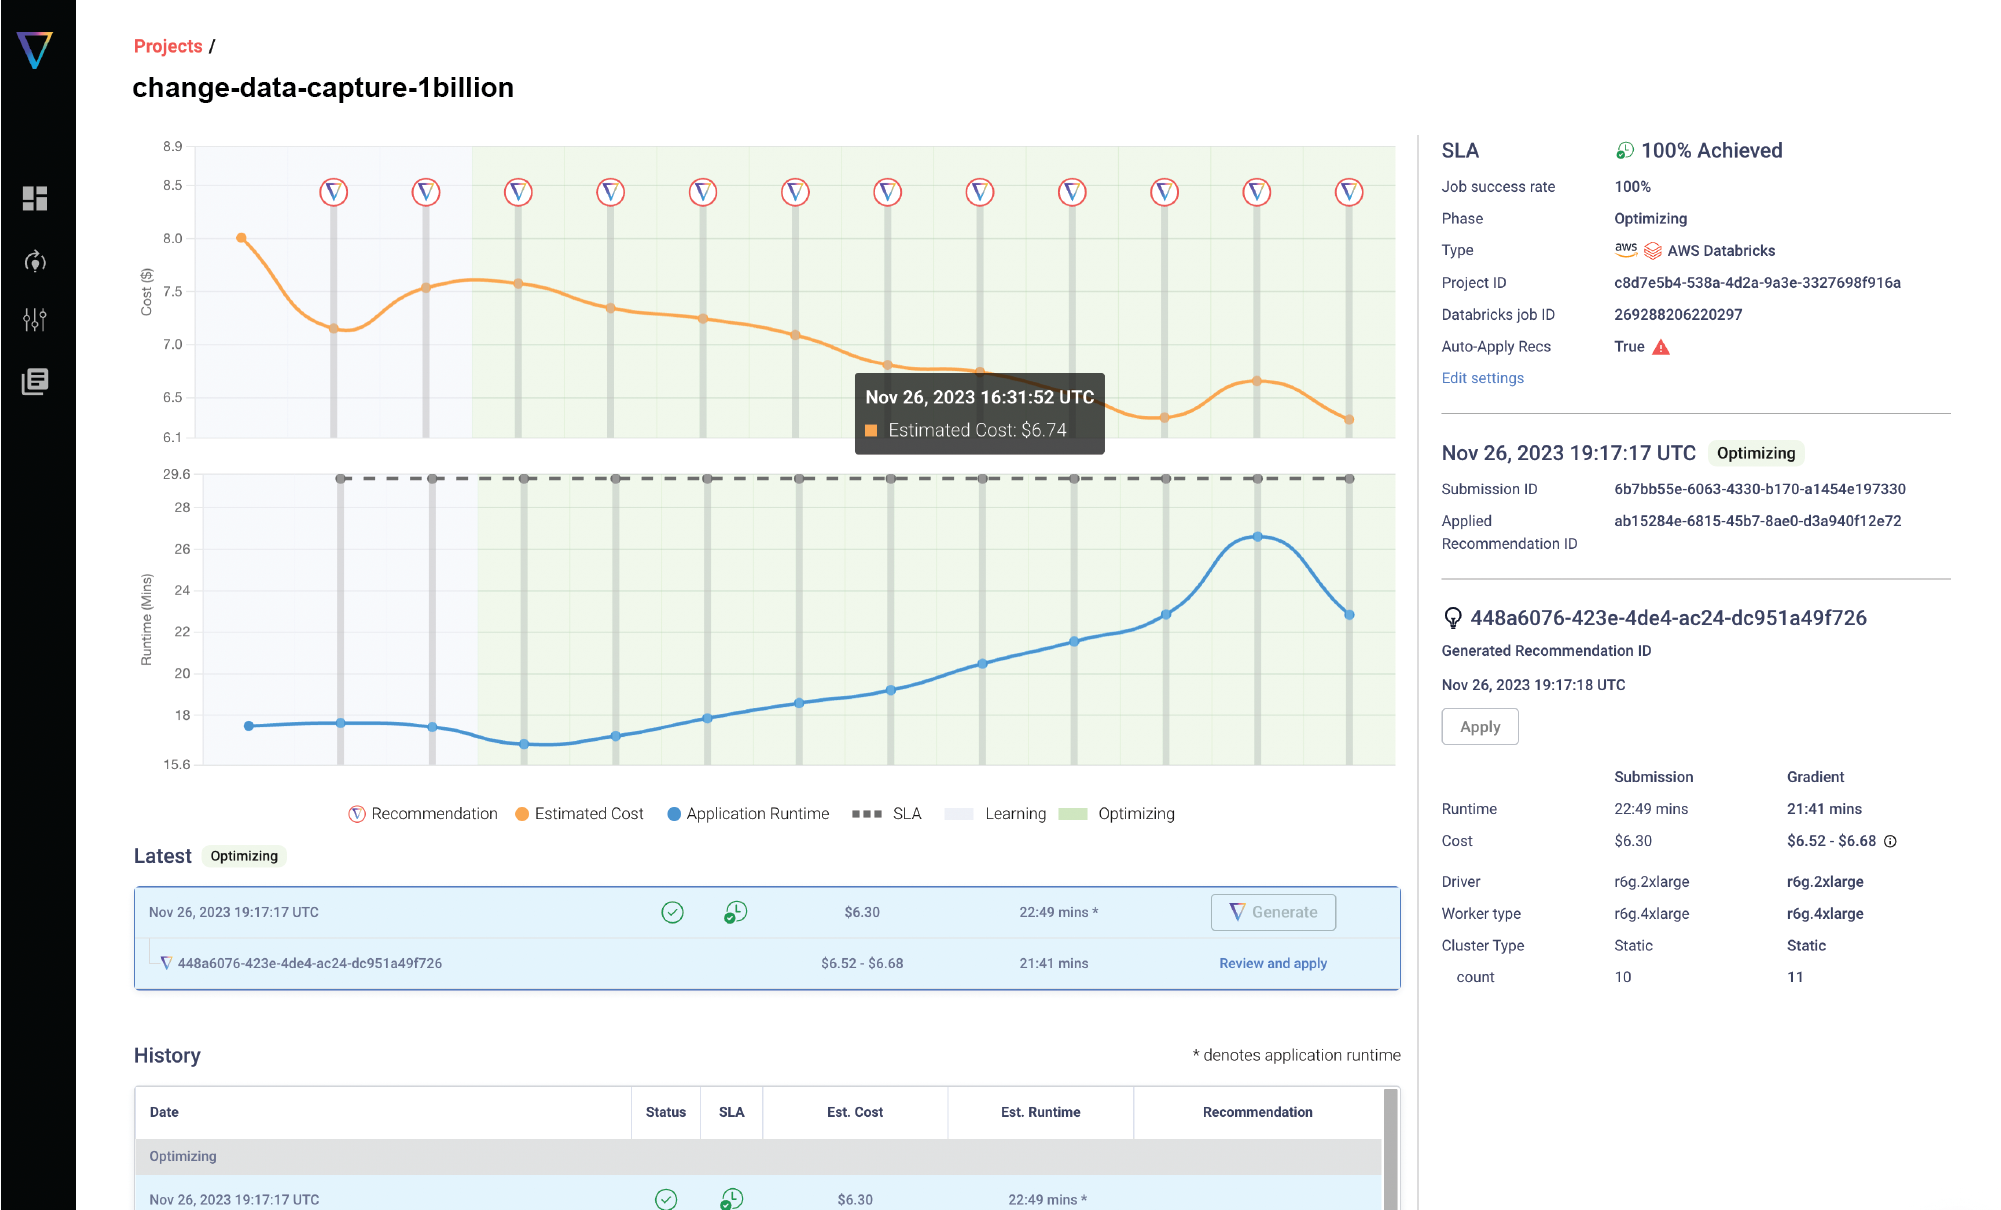
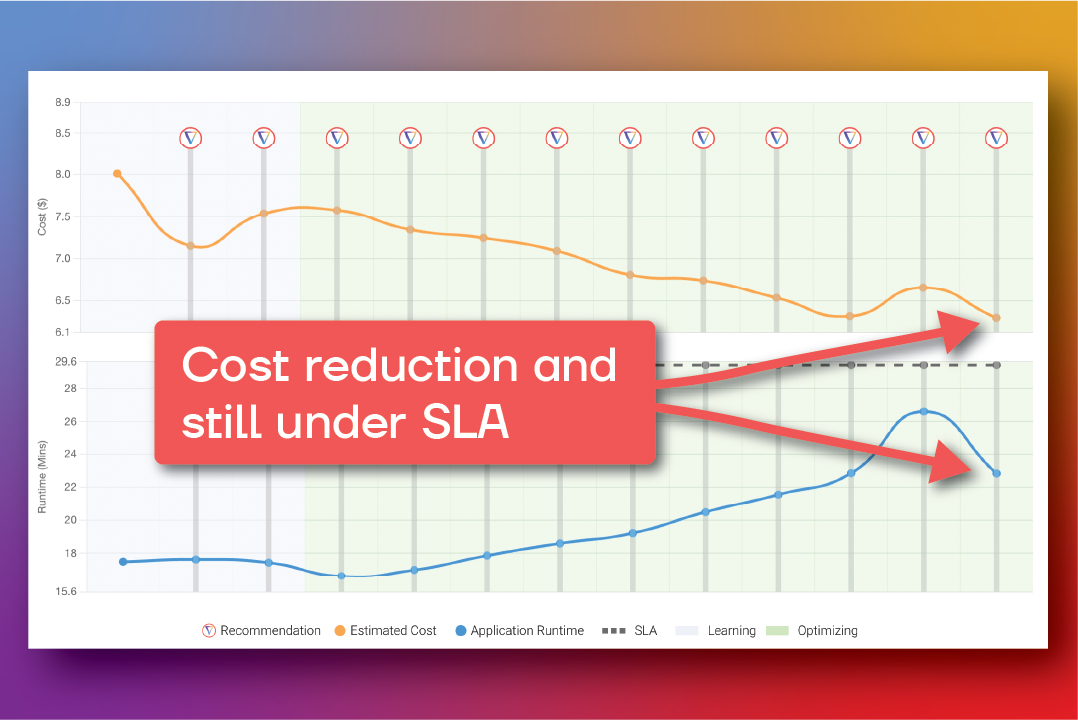
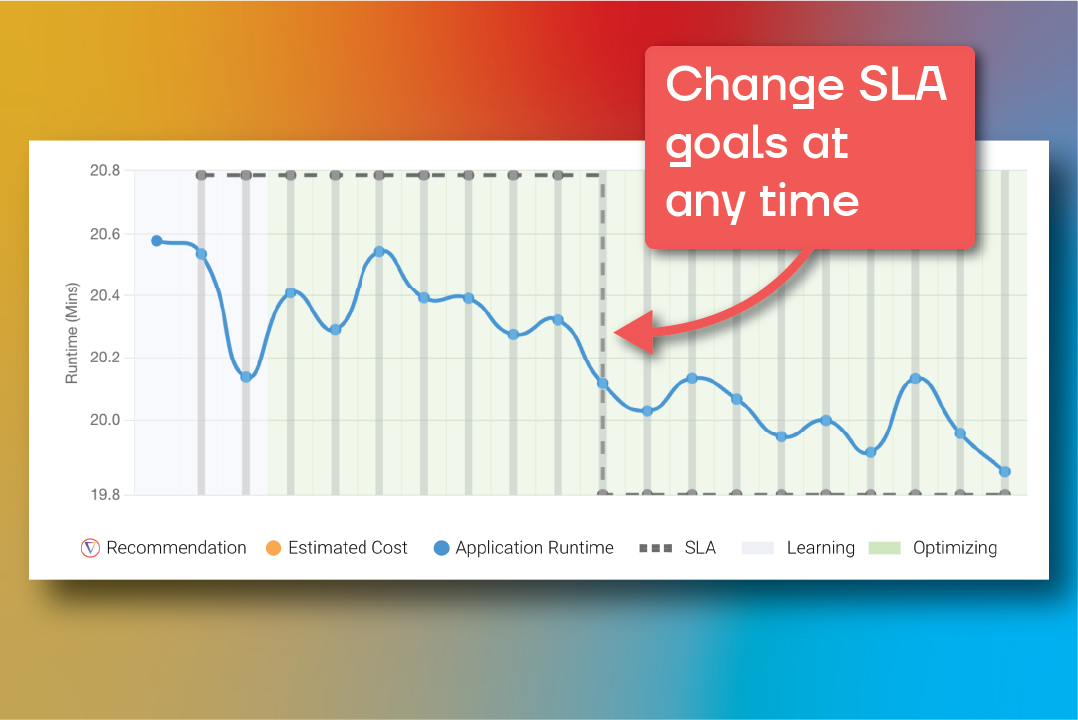
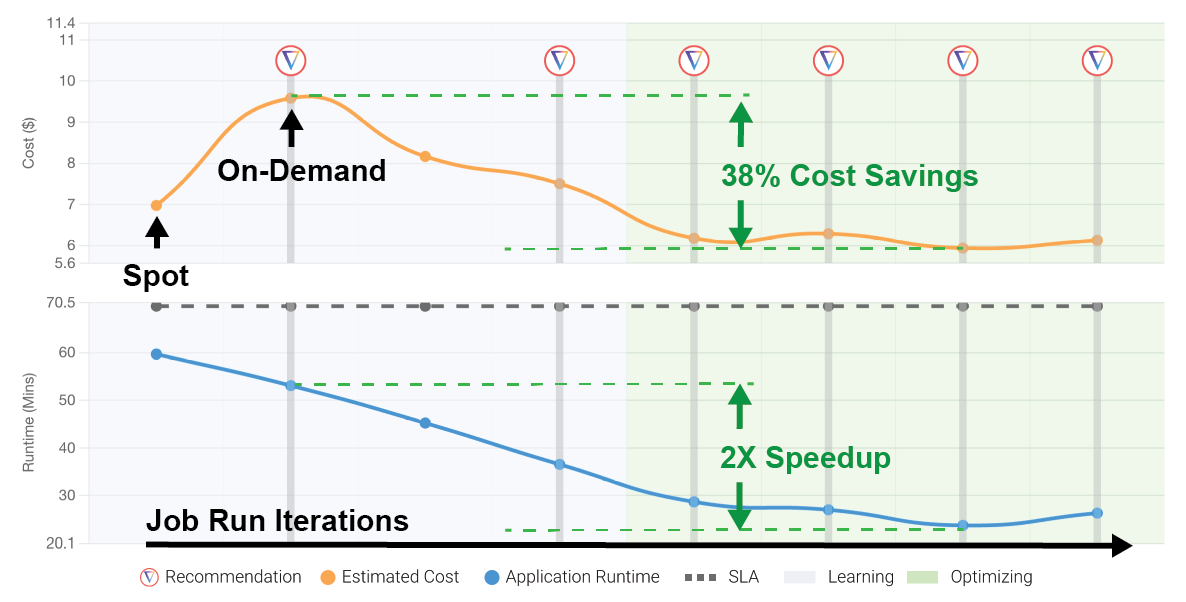
Below is a screenshot of a real user’s production Databricks cluster cost and runtime performance run with the Gradient solution.
Each point on the graph represents a production run of this users’s job. With the feedback loop in place, the system was able to achieve the goals of reducing cost and runtime quite substantially by optimizing the compute infrastructure and cluster settings on AWS.
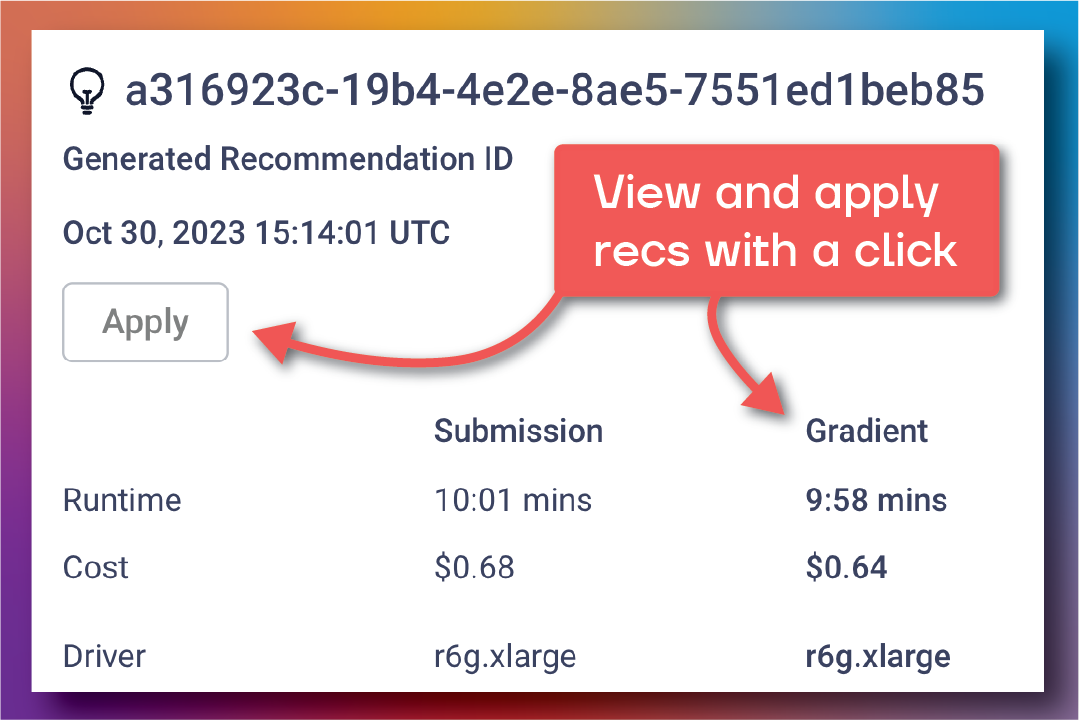
These changes occurred automatically as the Gradient solution trains and applies its prediction model to this particular workload.
Conclusion
The big vision of what we’re trying to achieve here at Sync goes well beyond Databricks clusters. The concept behind “Declarative Computing” is general and can apply to any repeat workload. For example, any ETL job, Open source Spark, EMR on AWS, Serverless functions, Fargate, ECS, Kubernetes, GPUs, and any other system that runs scheduled jobs.
If you’d like to learn more, or think this concept could be applied to your infrastructure, please feel free to reach out! We’d love to talk shop about all things cloud infrastructure.
Book a demo with us to see for yourself!