Gradient introduces cloud and Databricks cost breakdowns

Get the full picture with a single pane of glass for your cloud spend

For data teams, understanding the true cost of operations has always been a complex puzzle. This is because your monthly bills come from multiple sources.
For example, when using Databricks you have:
- The Databricks bill for DBU consumption
- Your cloud provider’s bill (AWS, Azure, or GCP) for the infrastructure powering your Databricks workloads
This fragmented view makes it challenging to understand your true total cost of ownership (TCO). It also makes it difficult to identify opportunities for optimization. To combat these issue, we built a Cost Breakdown feature for Gradient. Read on for all the details!
The cost visibility challenge
Today’s data teams face several challenges when it comes to managing the costs of their Databricks workloads:
- Fragmented billing: Costs are split between Databricks processing and cloud provider compute bills, making it difficult to get a complete picture
- Limited granularity: Most solutions only show aggregated costs at the workspace level
- Manual reconciliation: Teams are forced to spend valuable time combining data from different sources to understand their true spending behavior
- Delayed insights: Current solutions rely on the billing systems provided by cloud providers and Databricks, which aren’t real-time
Introducing Gradient’s cost breakdown feature
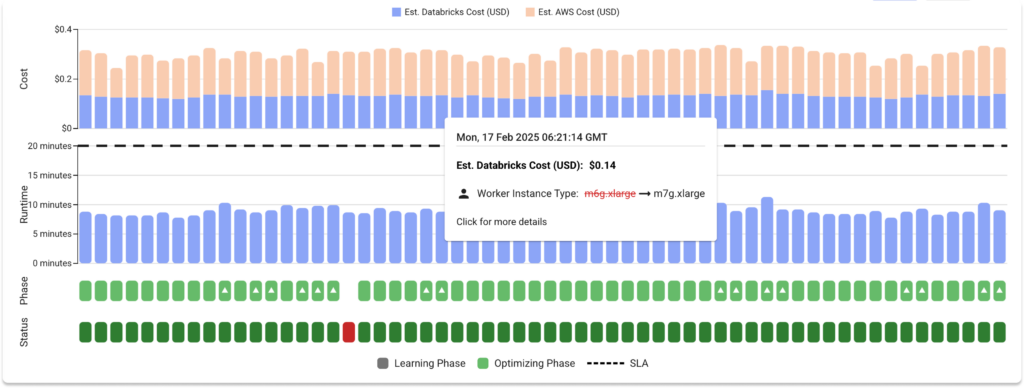
We’re excited to announce that Gradient now provides detailed cost breakdowns, showing you exactly how much you’re spending on Databricks versus your cloud infrastructure.
This new feature adds complete transparency to your data operations costs, by displaying both granular and aggregated costs in a single pane.
What you can see
- Databricks costs: Clear visibility into your DBU consumption and associated costs
- Cloud infrastructure costs: Detailed breakdown of spending on AWS, Azure, or GCP resources used to power you workloads
- Workload-level details: Understand Databricks and cloud compute costs at the individual job level, not just workspace aggregates
- Temporal views: Track costs over time with daily, weekly, or monthly granularity

Why this matters
Understanding your data infrastructure costs is fundamental for data teams. Simply put, you cannot improve what you do not measure.
The level of cost transparency provided by Gradient enables you to identify opportunities for optimization across Databricks and cloud infrastructure. It also helps you justify spending by demonstrating ROI, proactively manage budgets before costs escalate, and make better informed decisions about resource allocation.
With Gradient’s cost breakdown feature, you can:
- Track trends: Monitor how your costs evolve over time and across different types of workloads
- Optimize holistically: Make decisions that consider both Databricks and cloud infrastructure costs
- Forecast accurately: Better predict future spending based on comprehensive historical data
- Report confidently: Share clear, detailed cost breakdowns with stakeholders
But Gradient doesn’t just show you the numbers, it also helps you optimize them. Our AI-powered optimization engine continuously analyzes your workload patterns and makes intelligent recommendations to reduce costs while maintaining performance. By understanding both your Databricks and cloud infrastructure costs, Gradient can suggest optimizations that consider the complete cost picture.
Getting started
The new cost breakdown feature is available now in your Gradient dashboard. Simply log in and onboard your workloads to get visual breakdowns of Databricks vs. cloud costs, aggregated cost trends over time, workload-level insights, and much more.
What’s next?
This is just another step in our journey to automate data infrastructure management for Databricks users. We’re continuously working on new features to help you understand and optimize your data infrastructure better.
As you well know, cluster management is very complicated. Things don’t always make sense, even when you have the raw metrics, like those that Gradient shows. This is why we’ve built an Insights feature that helps you get a better understanding of the nature of your workloads and distills insights based on lessons learned from managing tens of millions of core hours.
Below you can see a sneak peak of our upcoming Insights – stay tuned for more!

Conclusion
Gradient’s cost breakdown feature marks a significant advancement in cost management for Databricks users. By providing a unified view of Databricks and cloud infrastructure expenses, data teams can make more informed decisions and optimize their resources effectively. The ability to analyze costs at a granular level, combined with AI-driven optimizations and insights, offers a powerful solution.
As organizations increasingly rely on data-driven operations, tools like Gradient’s cost breakdown feature will become essential for maintaining financial efficiency and demonstrating ROI in the complex landscape of cloud-based data infrastructure.
If this sounds interesting to you and you haven’t yet seen Gradient in action, book a time here!
 Noa Shavit